Chapter 2
Guided tour: aiming for your first million
A complete tour, from the first deposit to the first million.
5 min read, 9 sections
On this page
This chapter follows Gabriel, 28, who earns €3,700 net a month, has just opened a life insurance contract and wants to know how fast he can reach one million. Each step refers to the relevant chapter.
2.1The starting point
Gabriel has a spreadsheet. Three tabs, columns that no longer add up since he opened a second contract, and no idea of what his fees really cost him over twenty years.
What he is looking for comes down to three questions: Where do I stand? Where am I heading? What is holding back my profits?
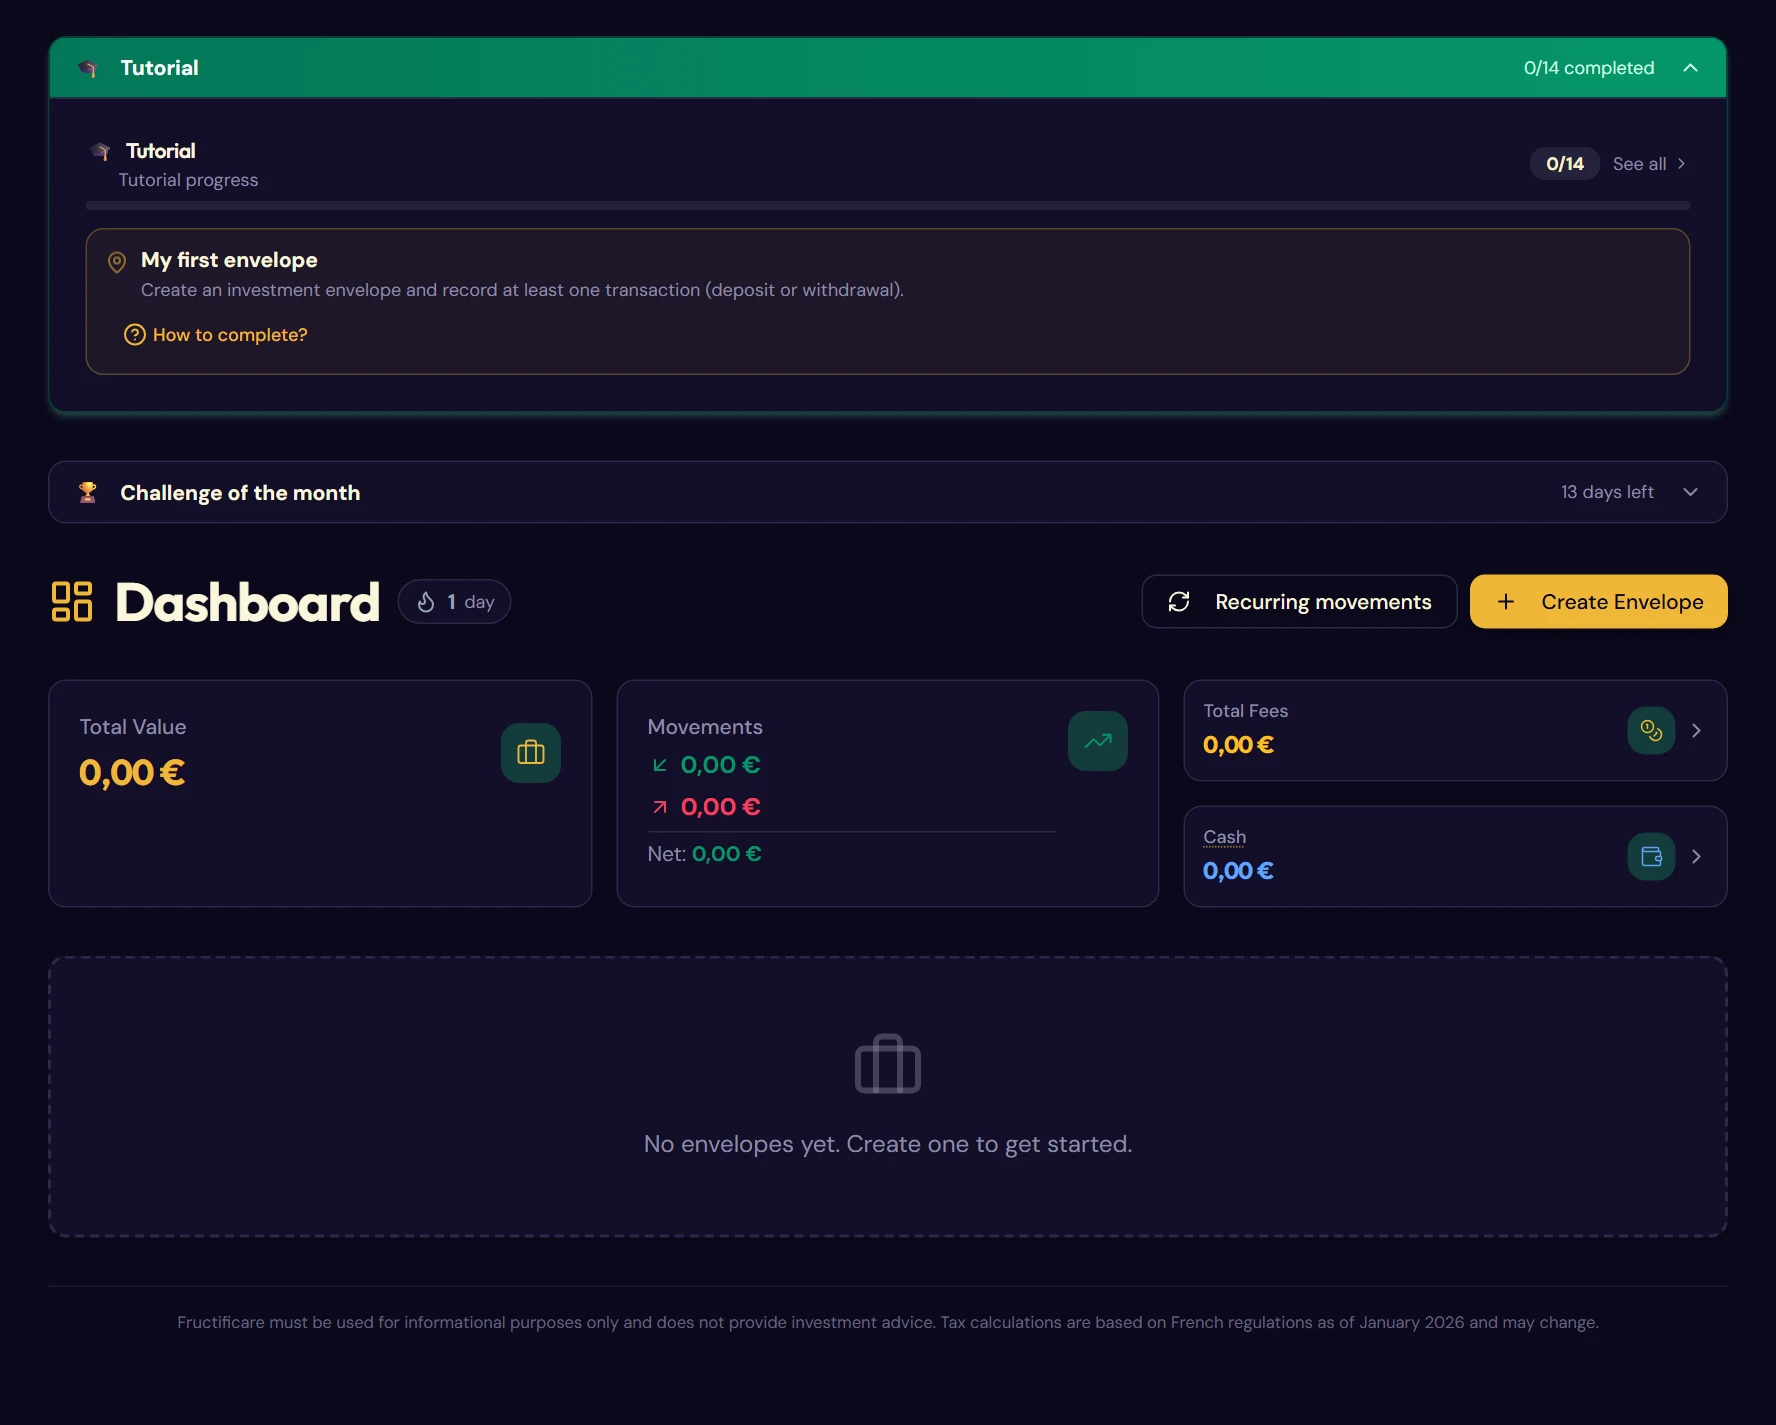
2.2Opening the envelope
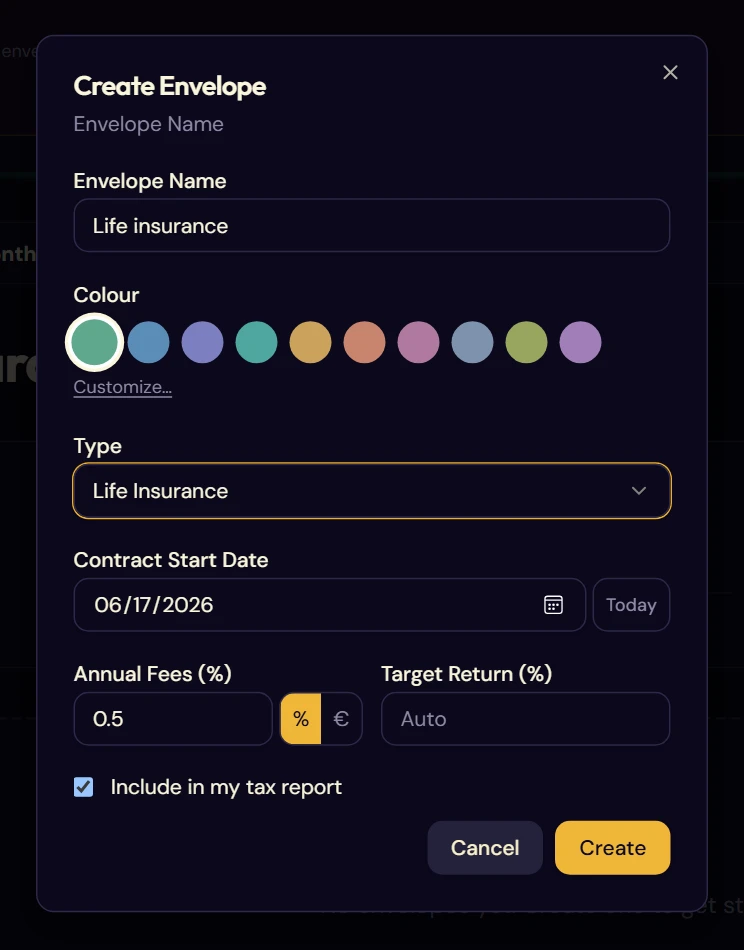
Gabriel creates his first envelope: Create Envelope, type Life Insurance, contract start date (§ 4.3).
This date starts the countdown to the eight years after which life insurance becomes tax-efficient. Fructificare will use it to show a green edge on the envelope's row when the day comes, and to apply the right tax regime in the tax report.
He also enters the contract's annual fees, which can usually be found in the contract's general terms. Movement fees can also be applied to each movement you create (§ 5.4).
2.3The first movements
He makes an initial deposit of €2,000 when the contract opens. Gabriel uses multiple asset types to split it 60% into euro funds and 40% into unit-linked funds, in a single entry (§ 5.4).
He uses the Note field to identify his movement. It is more than a simple comment: Fructificare groups all the movements that share the same note and calculates their total invested, number of units and weighted average purchase price (§ 5.9). Be careful: the note must be written exactly the same way from one movement to the next for the program to group them, and it is case-sensitive (“Weekly savings” and “weekly savings” will form two groups).
As he plans to repeat this deposit, he turns it into a movement template (chapter 7), the fees and the breakdown are remembered, and then a monthly recurring movement of €400 (chapter 8). From then on, data entry takes care of itself.
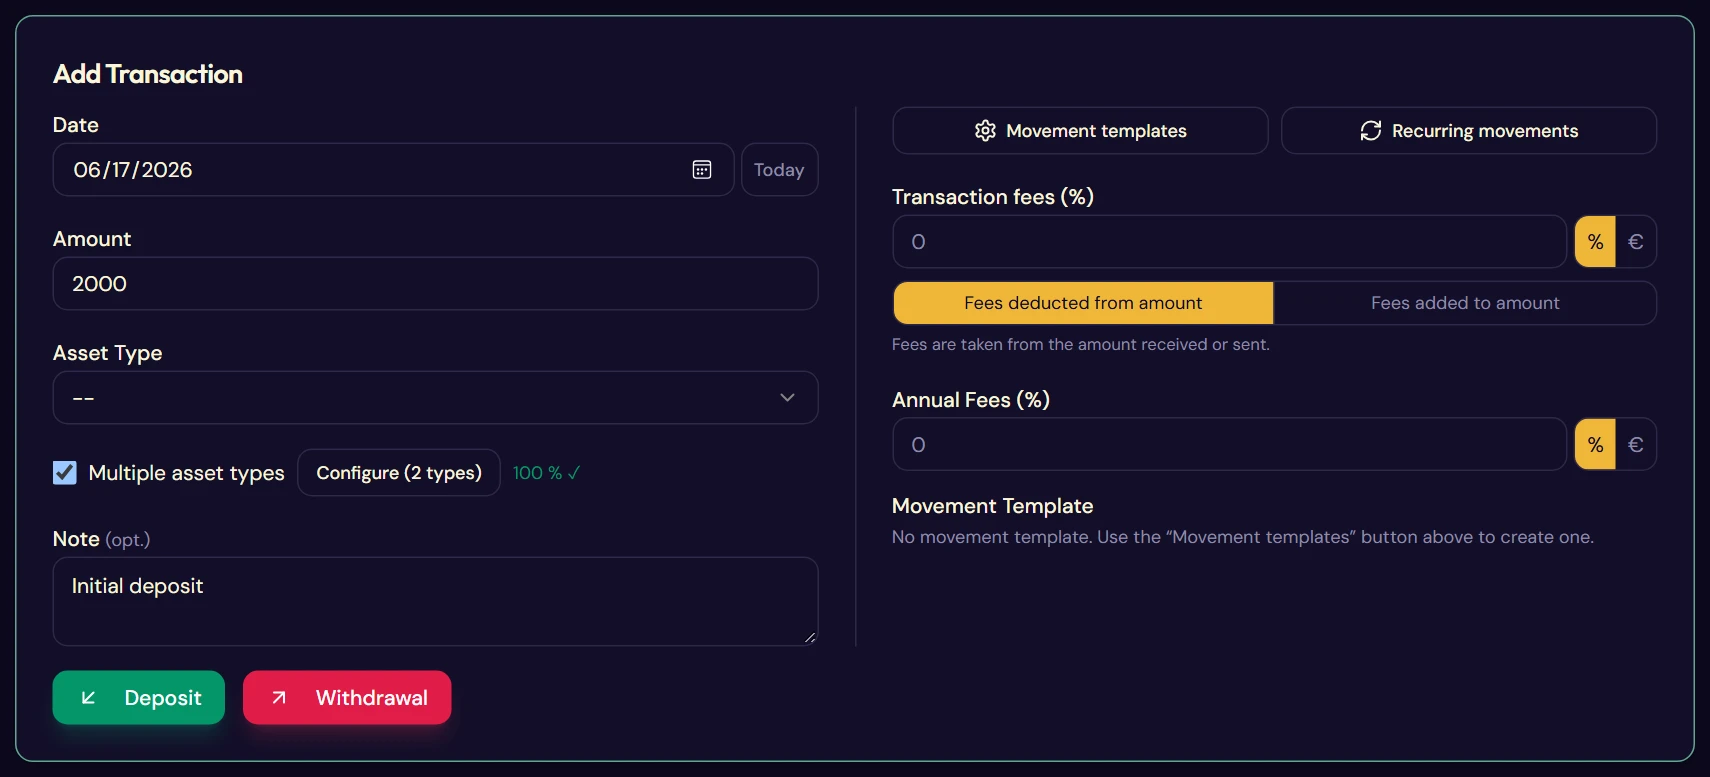
The add form, split over two asset types
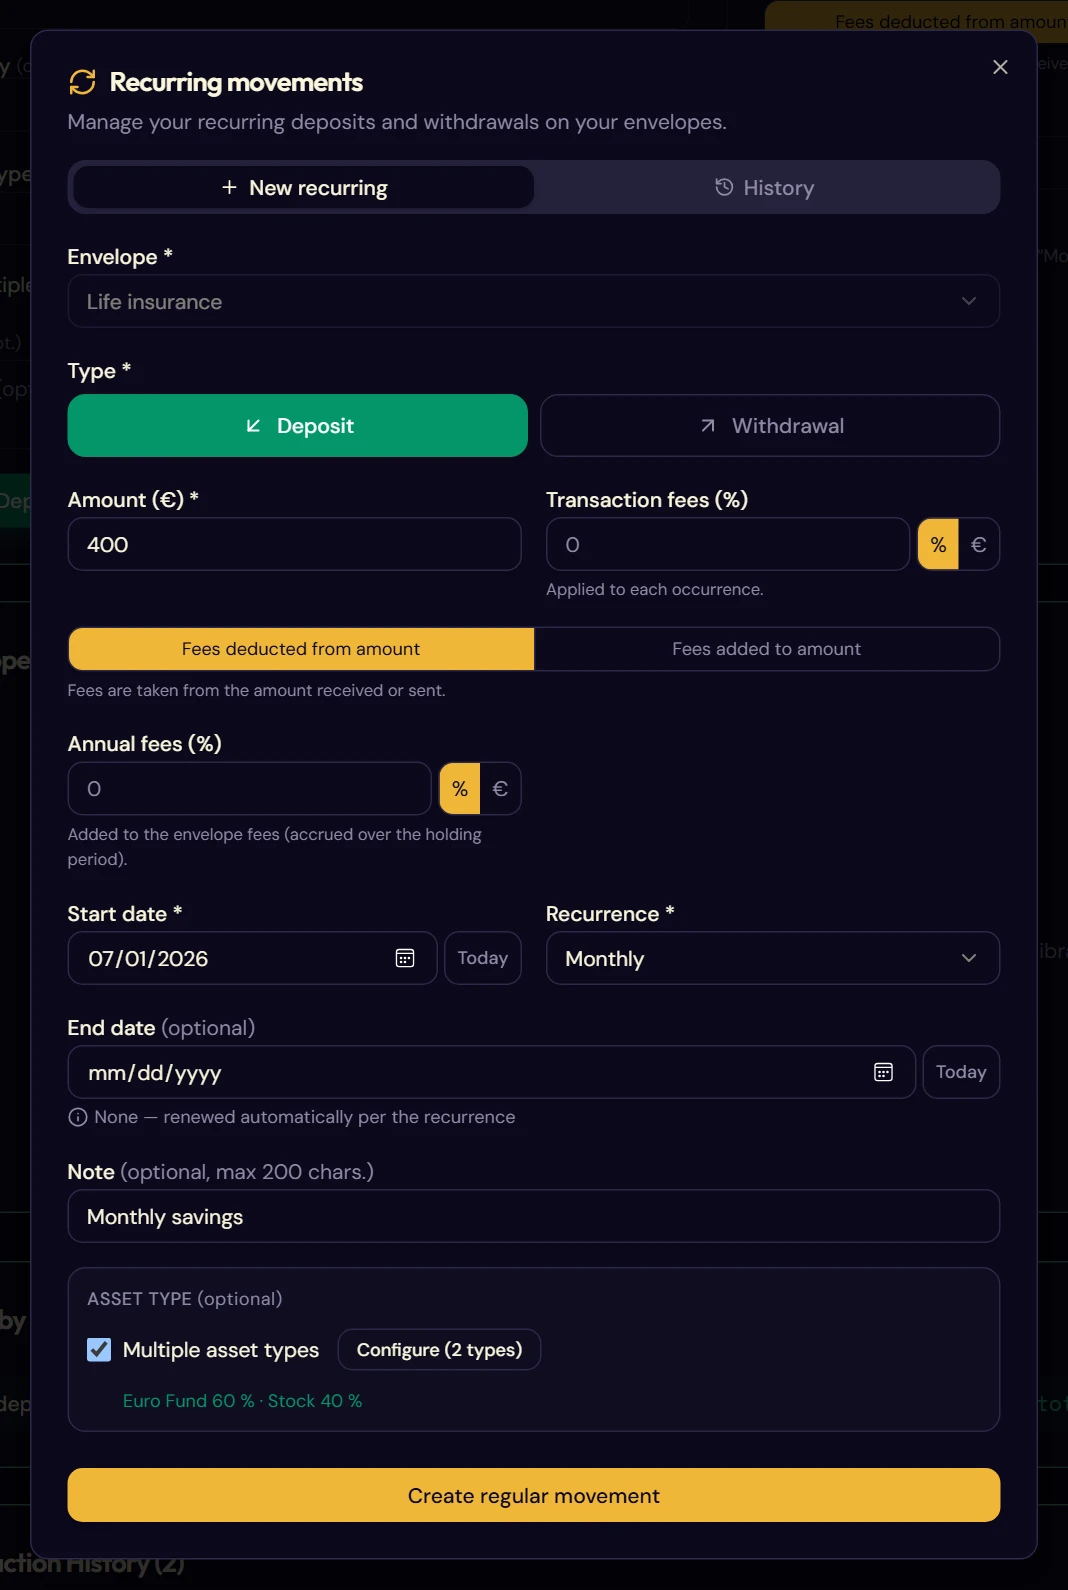
The “New recurring” tab
2.4Making the figures real: the first calibration
Three months later, the first statement for the life insurance contract arrives: €3,340. Gabriel opens Calibrate my envelopes and enters this value (chapter 6).
Until then, the application only showed the sum of the deposits. It can now show the real value and derive the performance, the gain and the annualized return from it.
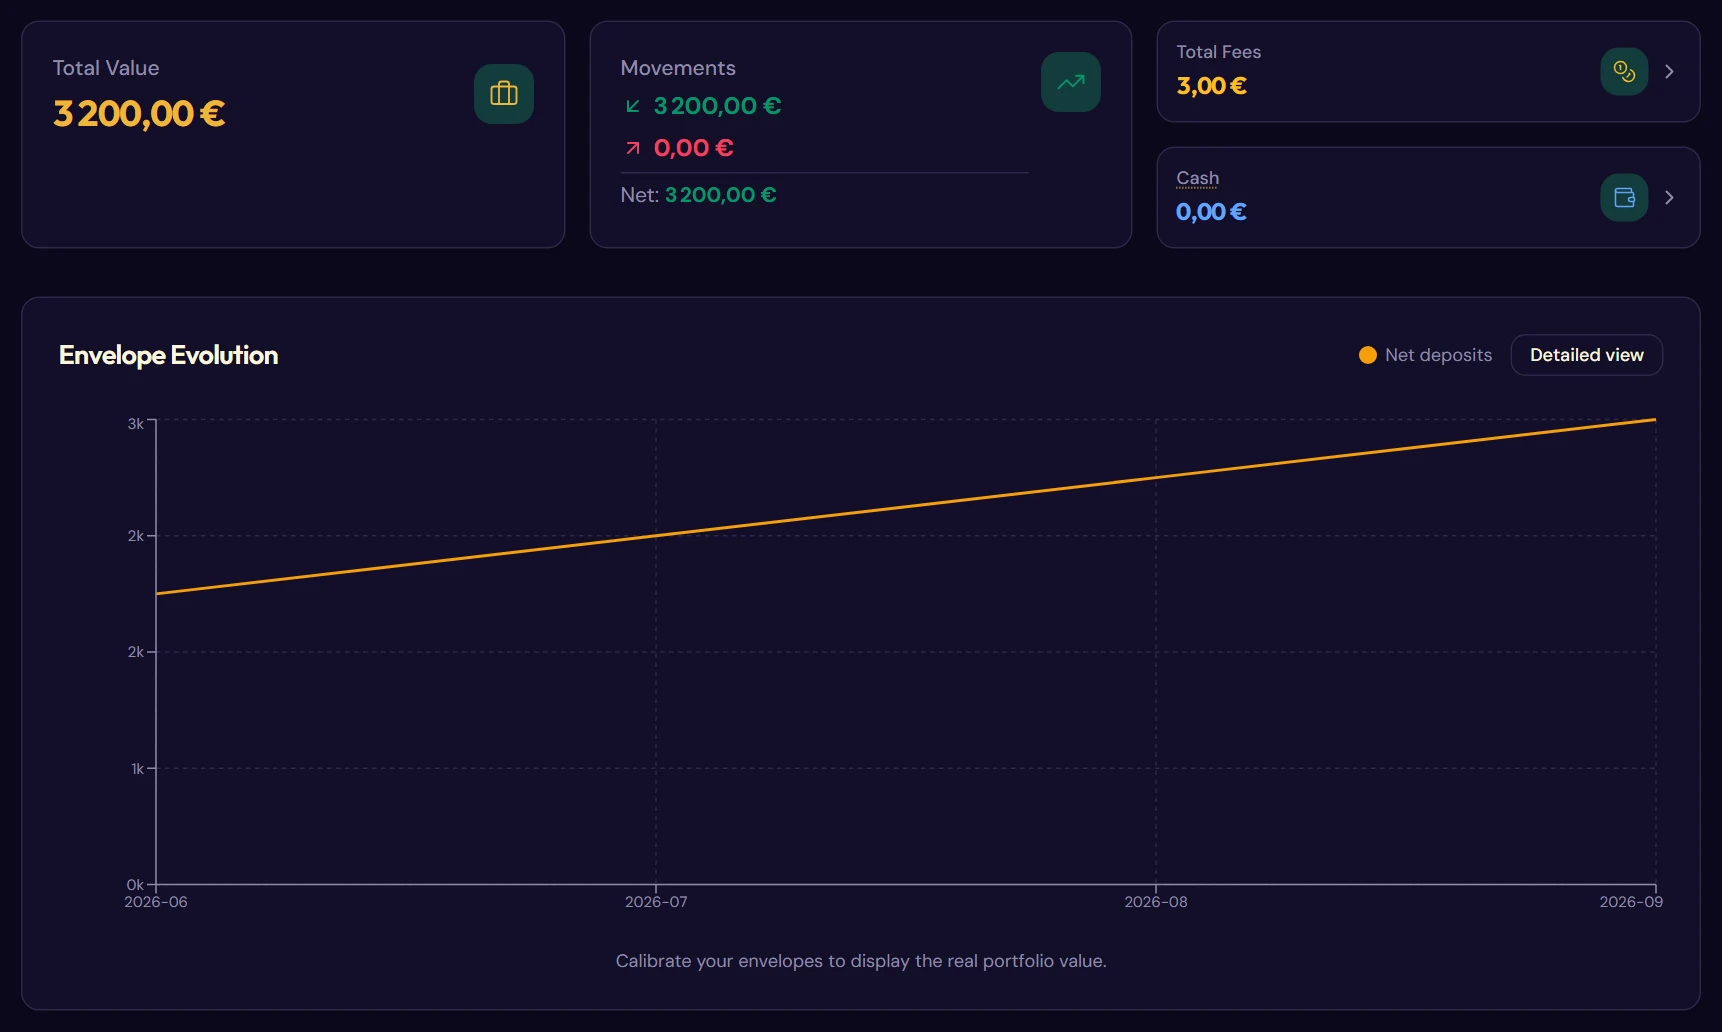
Before calibration
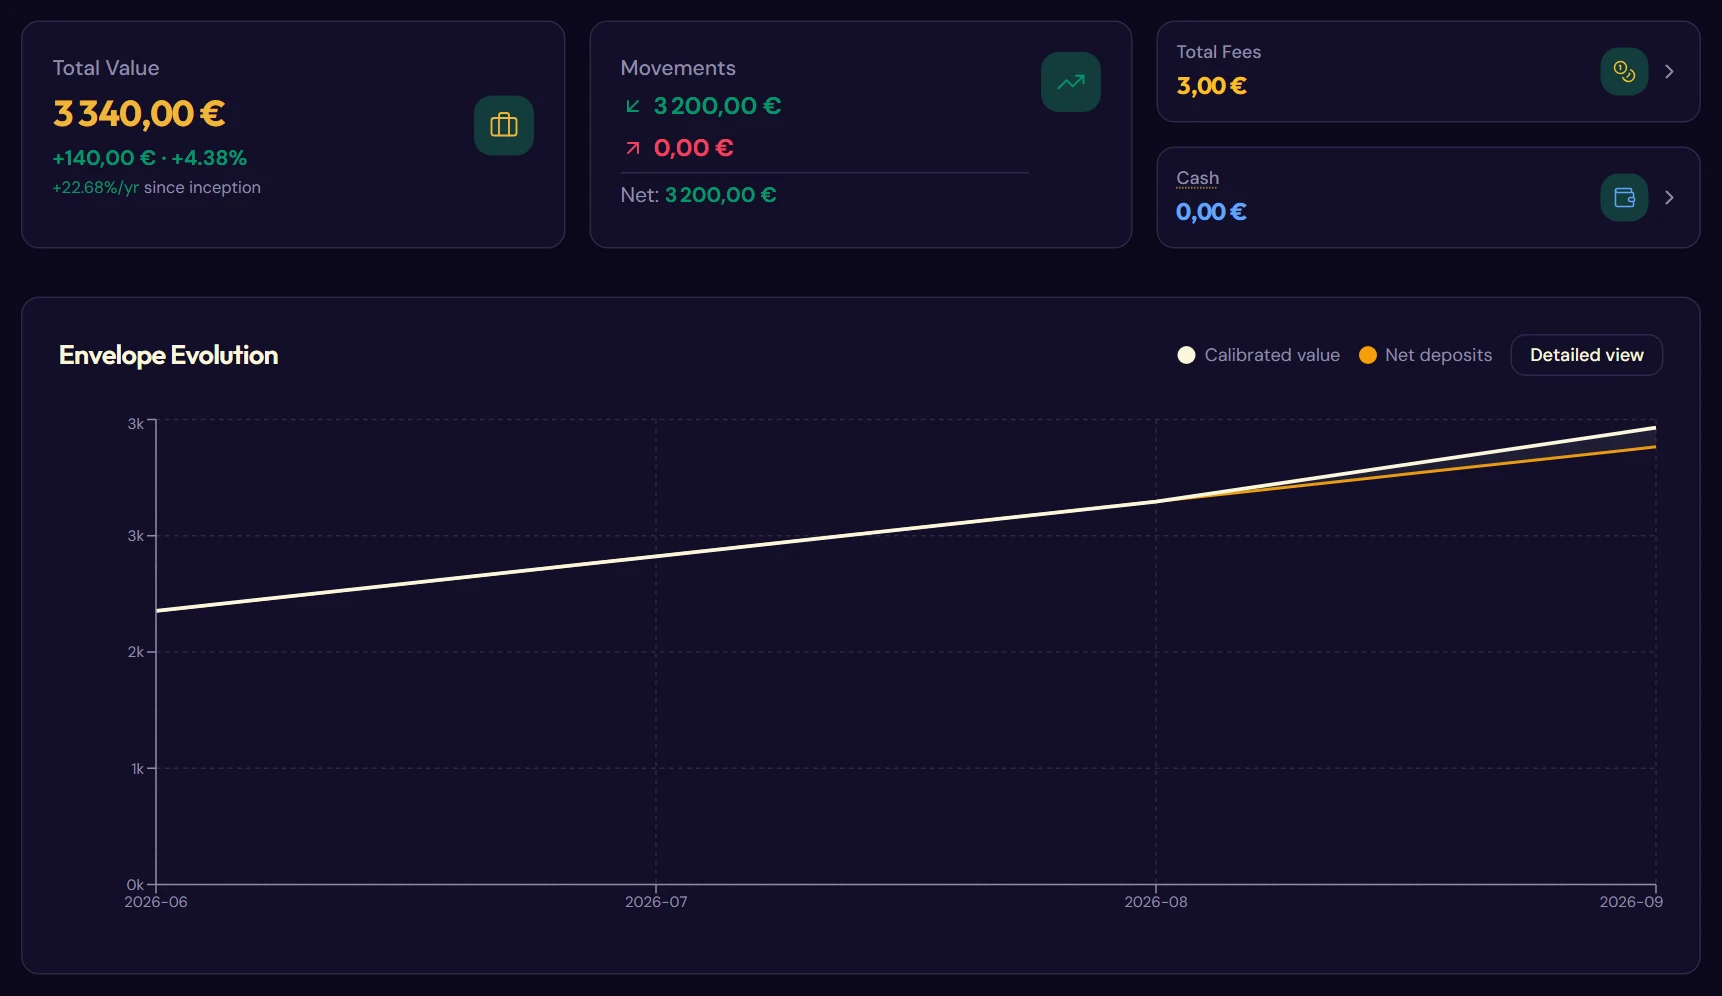
After calibration
2.5What it really costs: keeping fees in check
The Total Fees tile on the dashboard shows an amount and, above all, its breakdown by envelope (§ 4.4). Gabriel discovers that his annual fees already weigh more than his deposit fees.
To measure what this means in the long run, he does the decisive exercise: two identical simulations with different fee levels (§ 10.3). After twenty years, the gap is counted in tens of thousands of euros.
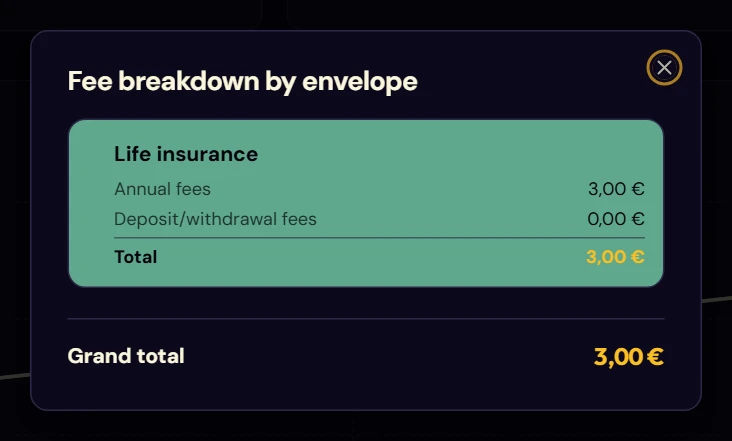
The fee breakdown by envelope
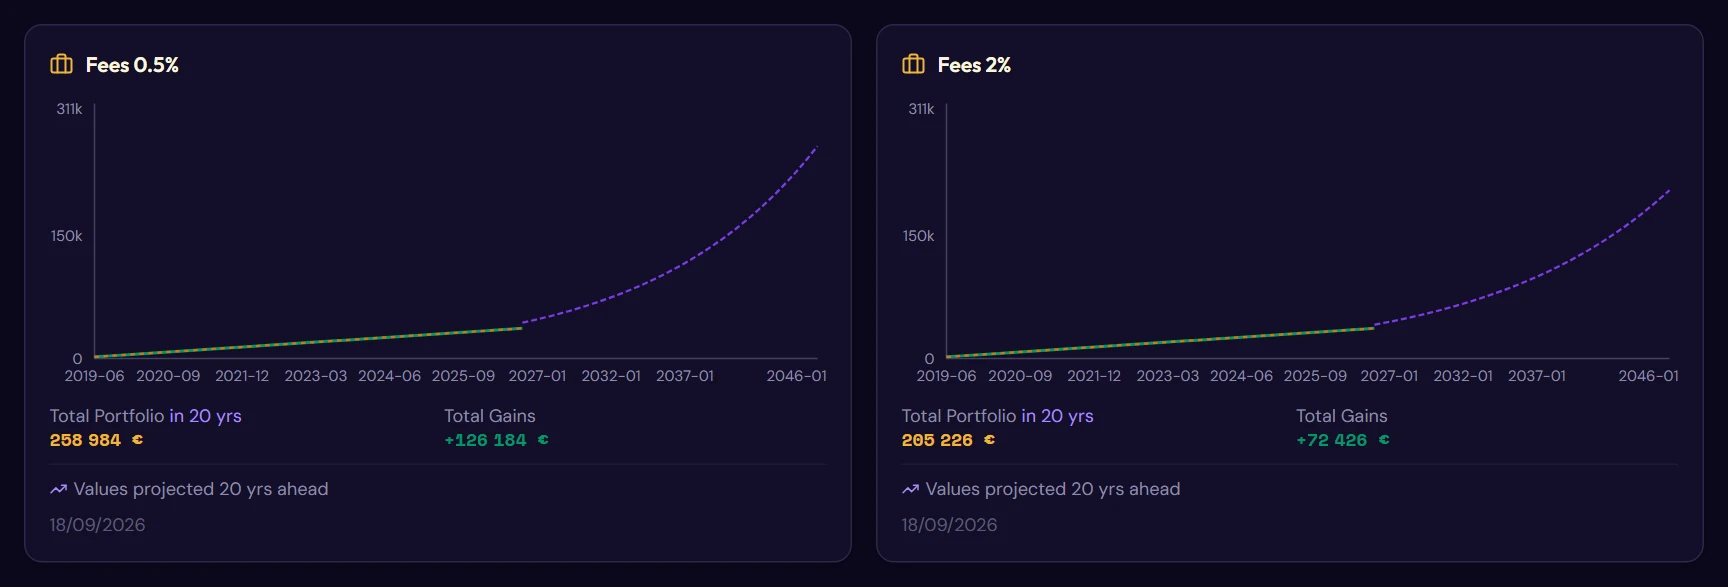
Two twenty-year simulations, with 0.5% and 2% fees
2.6What it yields: the projection
Gabriel creates a simulation from his real envelopes (§ 10.2), moves the year slider up to his 50th birthday, then turns on the inflation option to see the real purchasing power of his million euros in 2048.
Two milestones appear along the way: 1- The Crossover Point, the moment when cumulative interest exceeds deposits; it is often a key moment in investing, after which interest becomes exponential because your compound interest becomes the main driver of your savings, overtaking your personal effort. 2- FIRE progress (Financial Independence, Retire Early) represents the final capital needed to live off your passive income.
Finally, the stress test lets you simulate a crash halfway through and see the resulting trajectory. It depends on the asset types in your savings and helps you anticipate a future crisis.
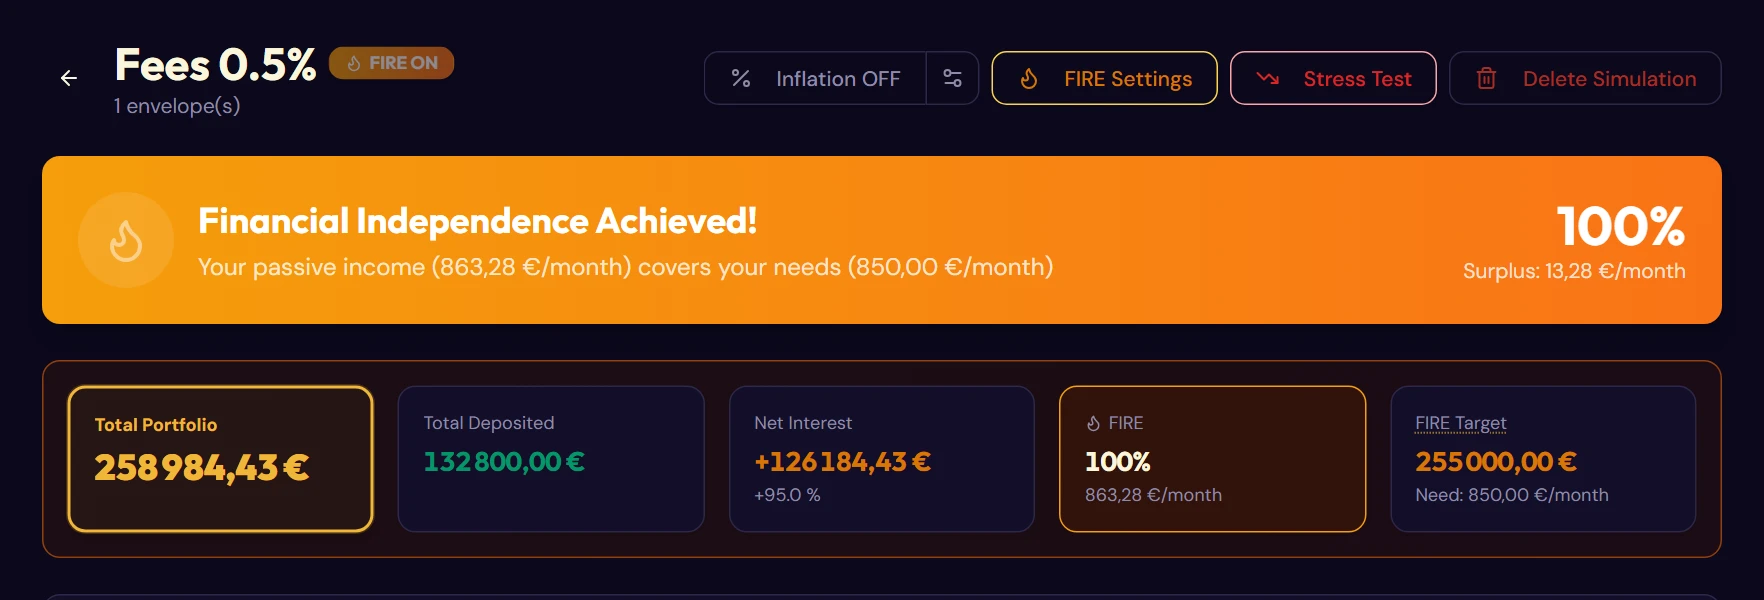
The twenty-year simulation
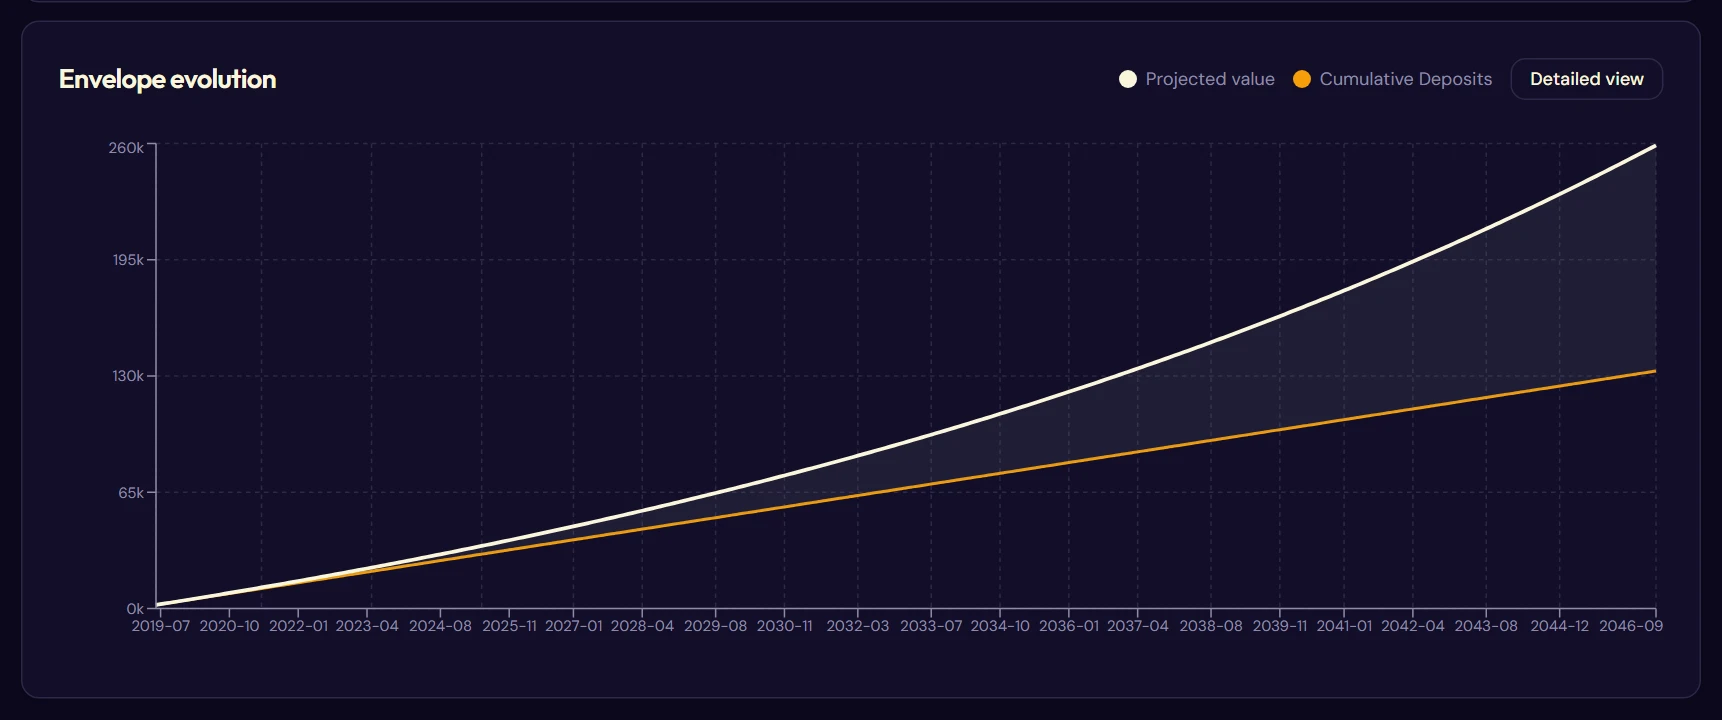
Its projection curve

After the stress test
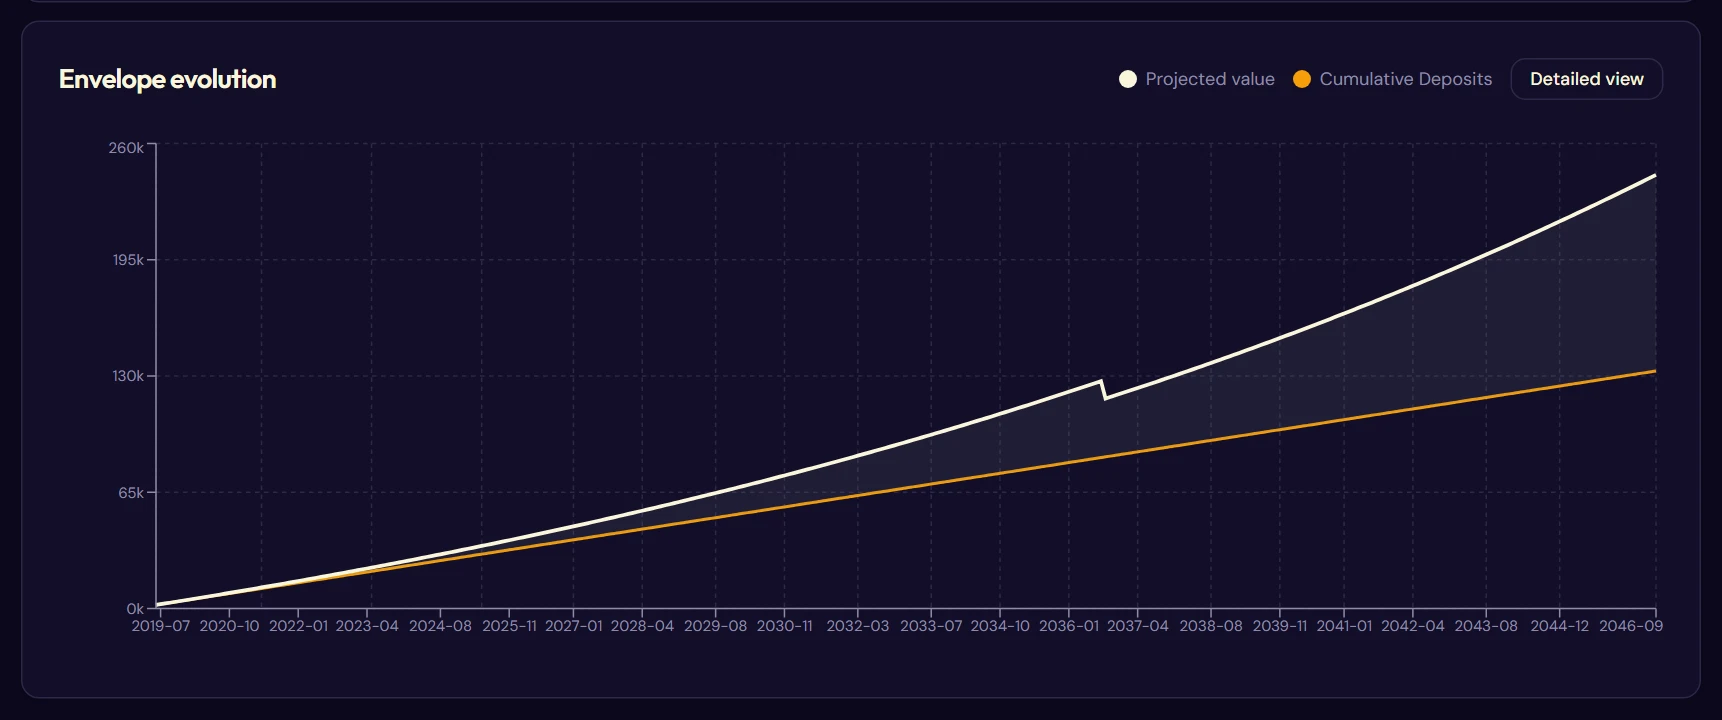
The curve after the crash
2.7What the State will take: anticipating tax
Gabriel simulates a withdrawal after six years, then the same one after nine years, in the Tax Simulator (§ 11.1). The difference in the final bill fits in one line: the €4,600 allowance and the reduced 7.5% rate only apply after eight years.
Practical conclusion: it is much more worthwhile to wait for the eight-year mark, which saves several hundred euros of tax on a withdrawal of this size.
In January, he generates his tax report for the previous year (§ 11.2) and files it with his supporting documents.
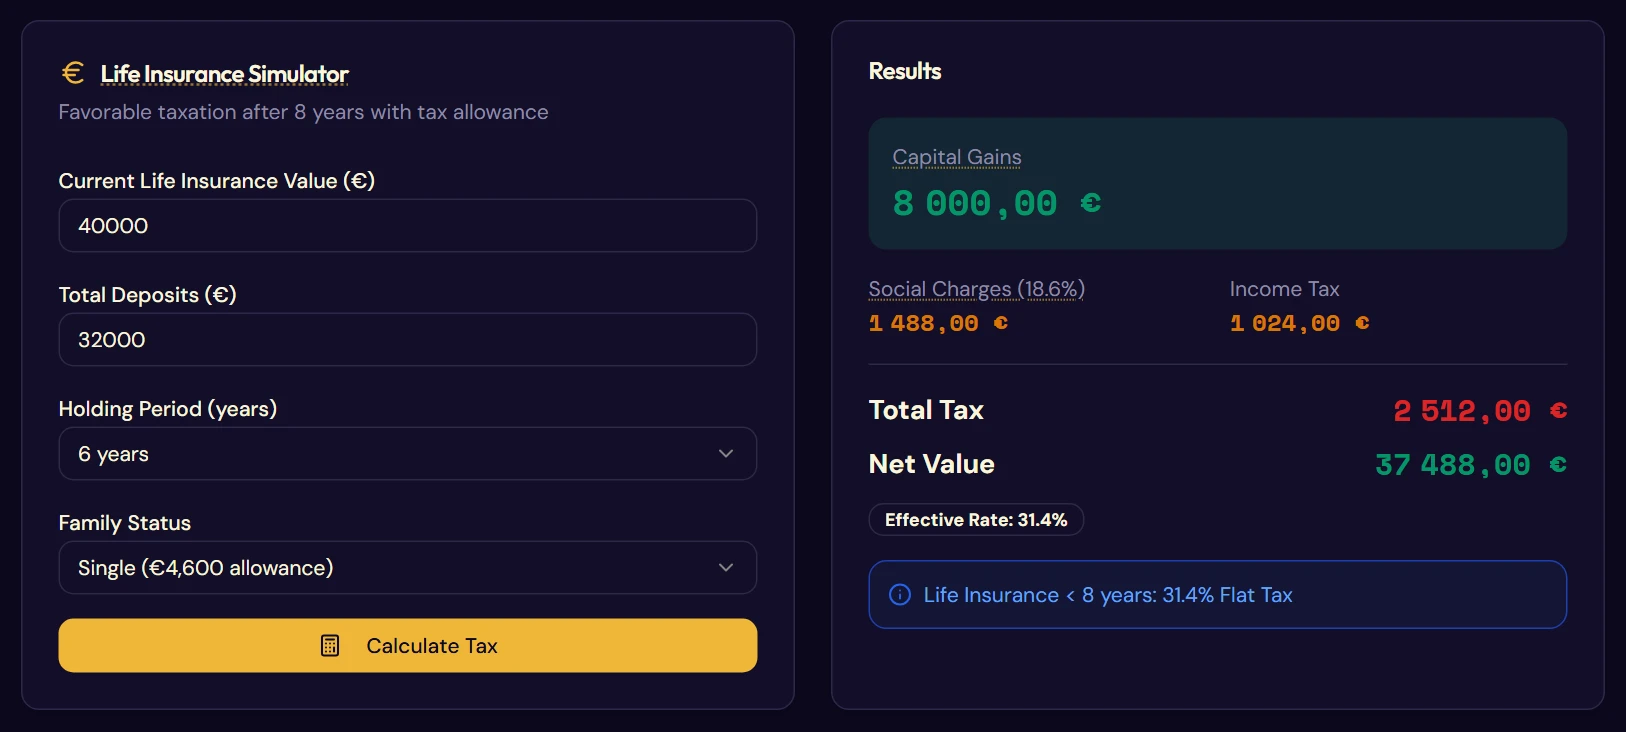
Withdrawal after 6 years
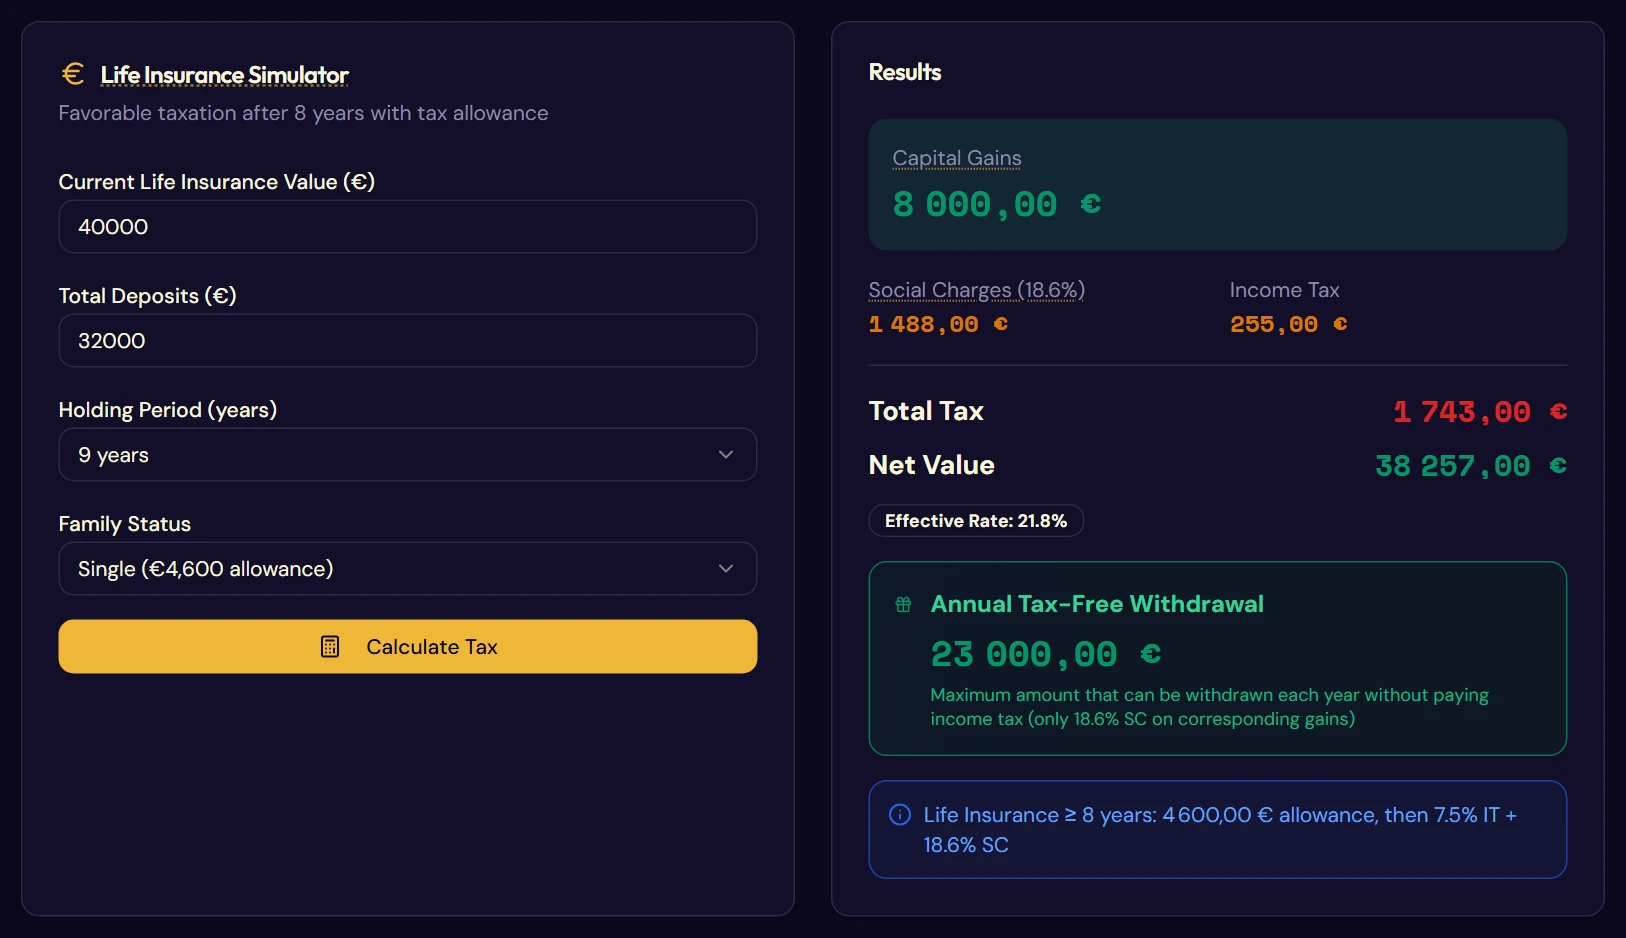
Withdrawal after 9 years
2.8Going the distance
A twenty-year plan does not hold through willpower. It holds through rhythm.
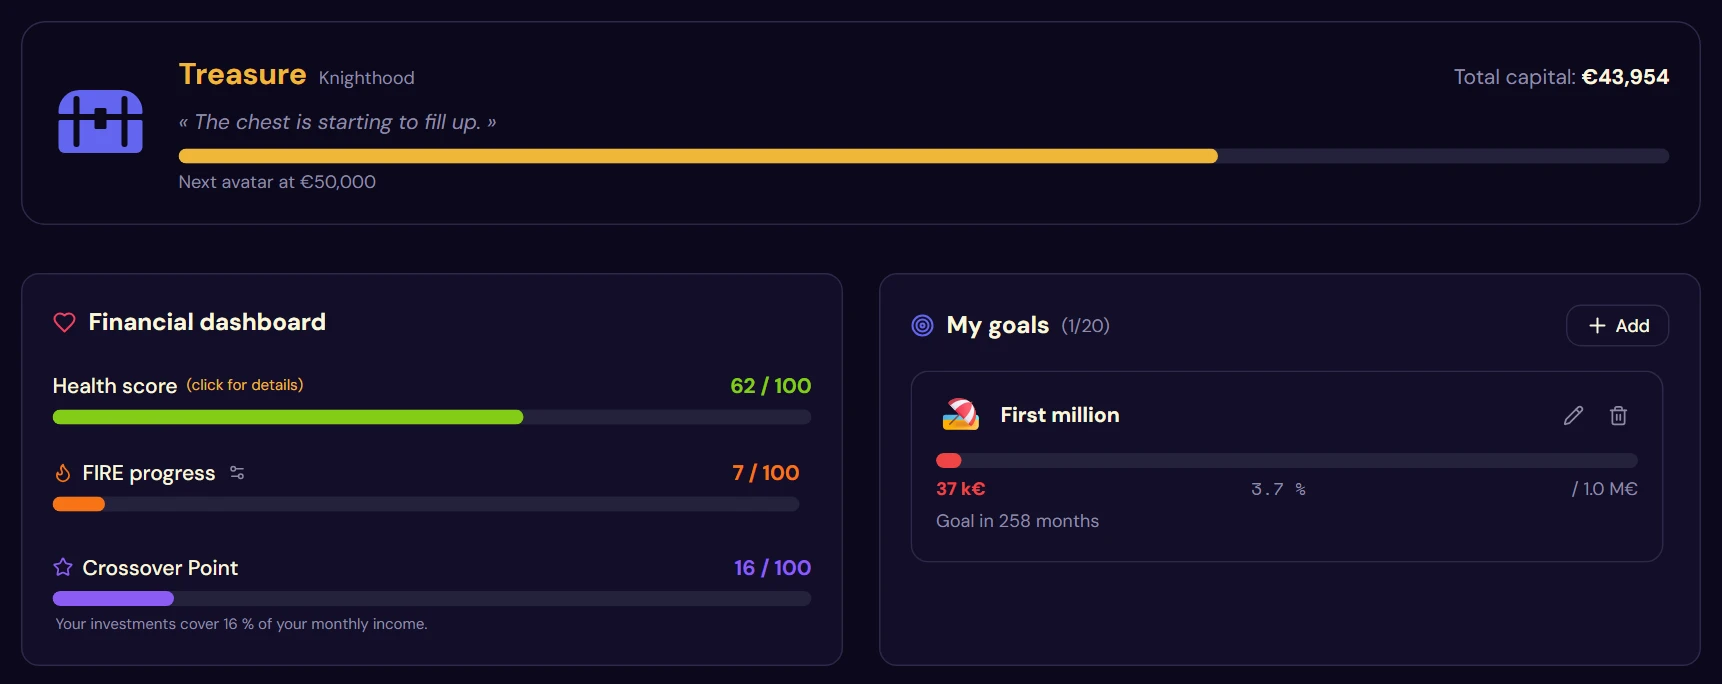
- The “first million” goal is set in My goals, with its target date and progress bar (§ 13.3).
- A calibration reminder comes back to the calendar every month (§ 9.2), so that the figures stay up to date.
- The monthly challenge suggests a different concrete action every month (§ 13.5).
- The avatar goes up its tiers as the capital grows: from the first steps to the backpack, then the shield, the fortress and the treasure (§ 13.1).
Finally, the 8-4-3 rule (§ 10.5) helps him leave his savings alone: compound interest rewards the last years above all, and each early withdrawal cuts the snowball effect at the very moment it starts to gather speed.
2.9The virtuous circle
All of Fructificare fits in a cycle of a few minutes, to be repeated every month for best results.
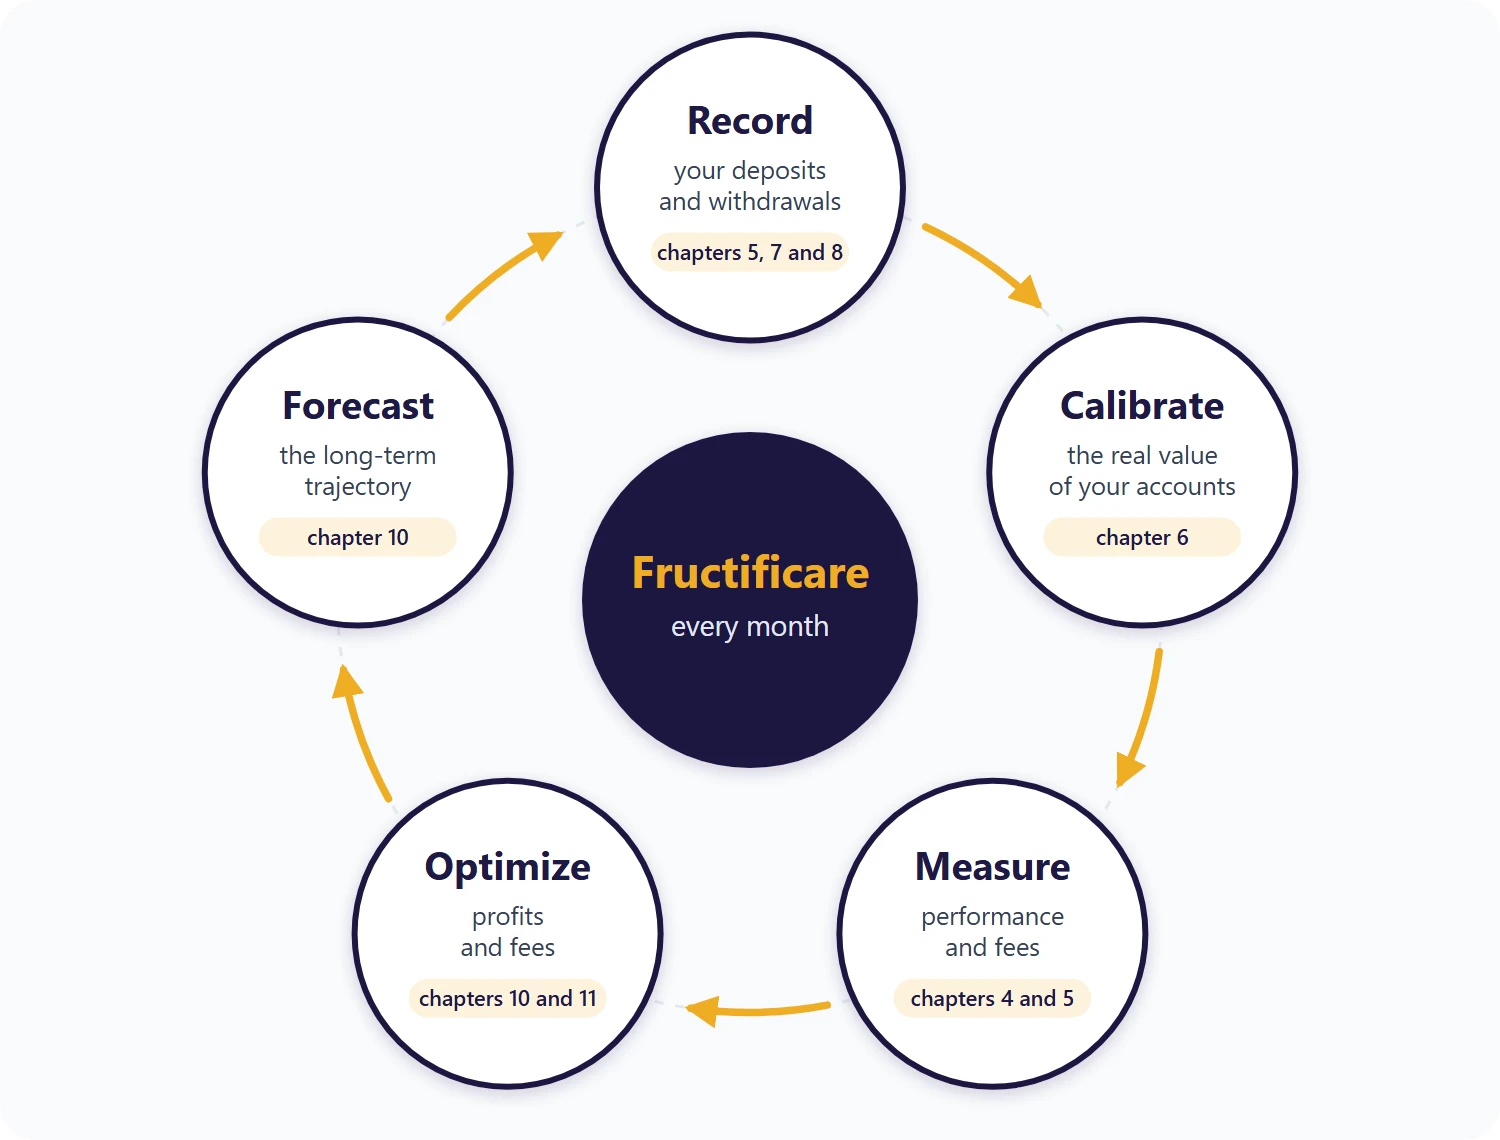
Record your movements, calibrate to anchor the figures in reality, measure performance and fees, optimize profits and fees, forecast to check that the trajectory holds. Then start again.