Chapter 10
Simulations
Project your wealth, test scenarios and discover the 8‑4‑3 rule.
4 min read, 5 sections
On this page
Simulations in Fructificare let you project what might happen. It is a scratch space: nothing you do there touches your real envelopes. You can test a higher deposit, a crash or an early retirement there, with no risk at all to your data.
10.1Two tools, two questions
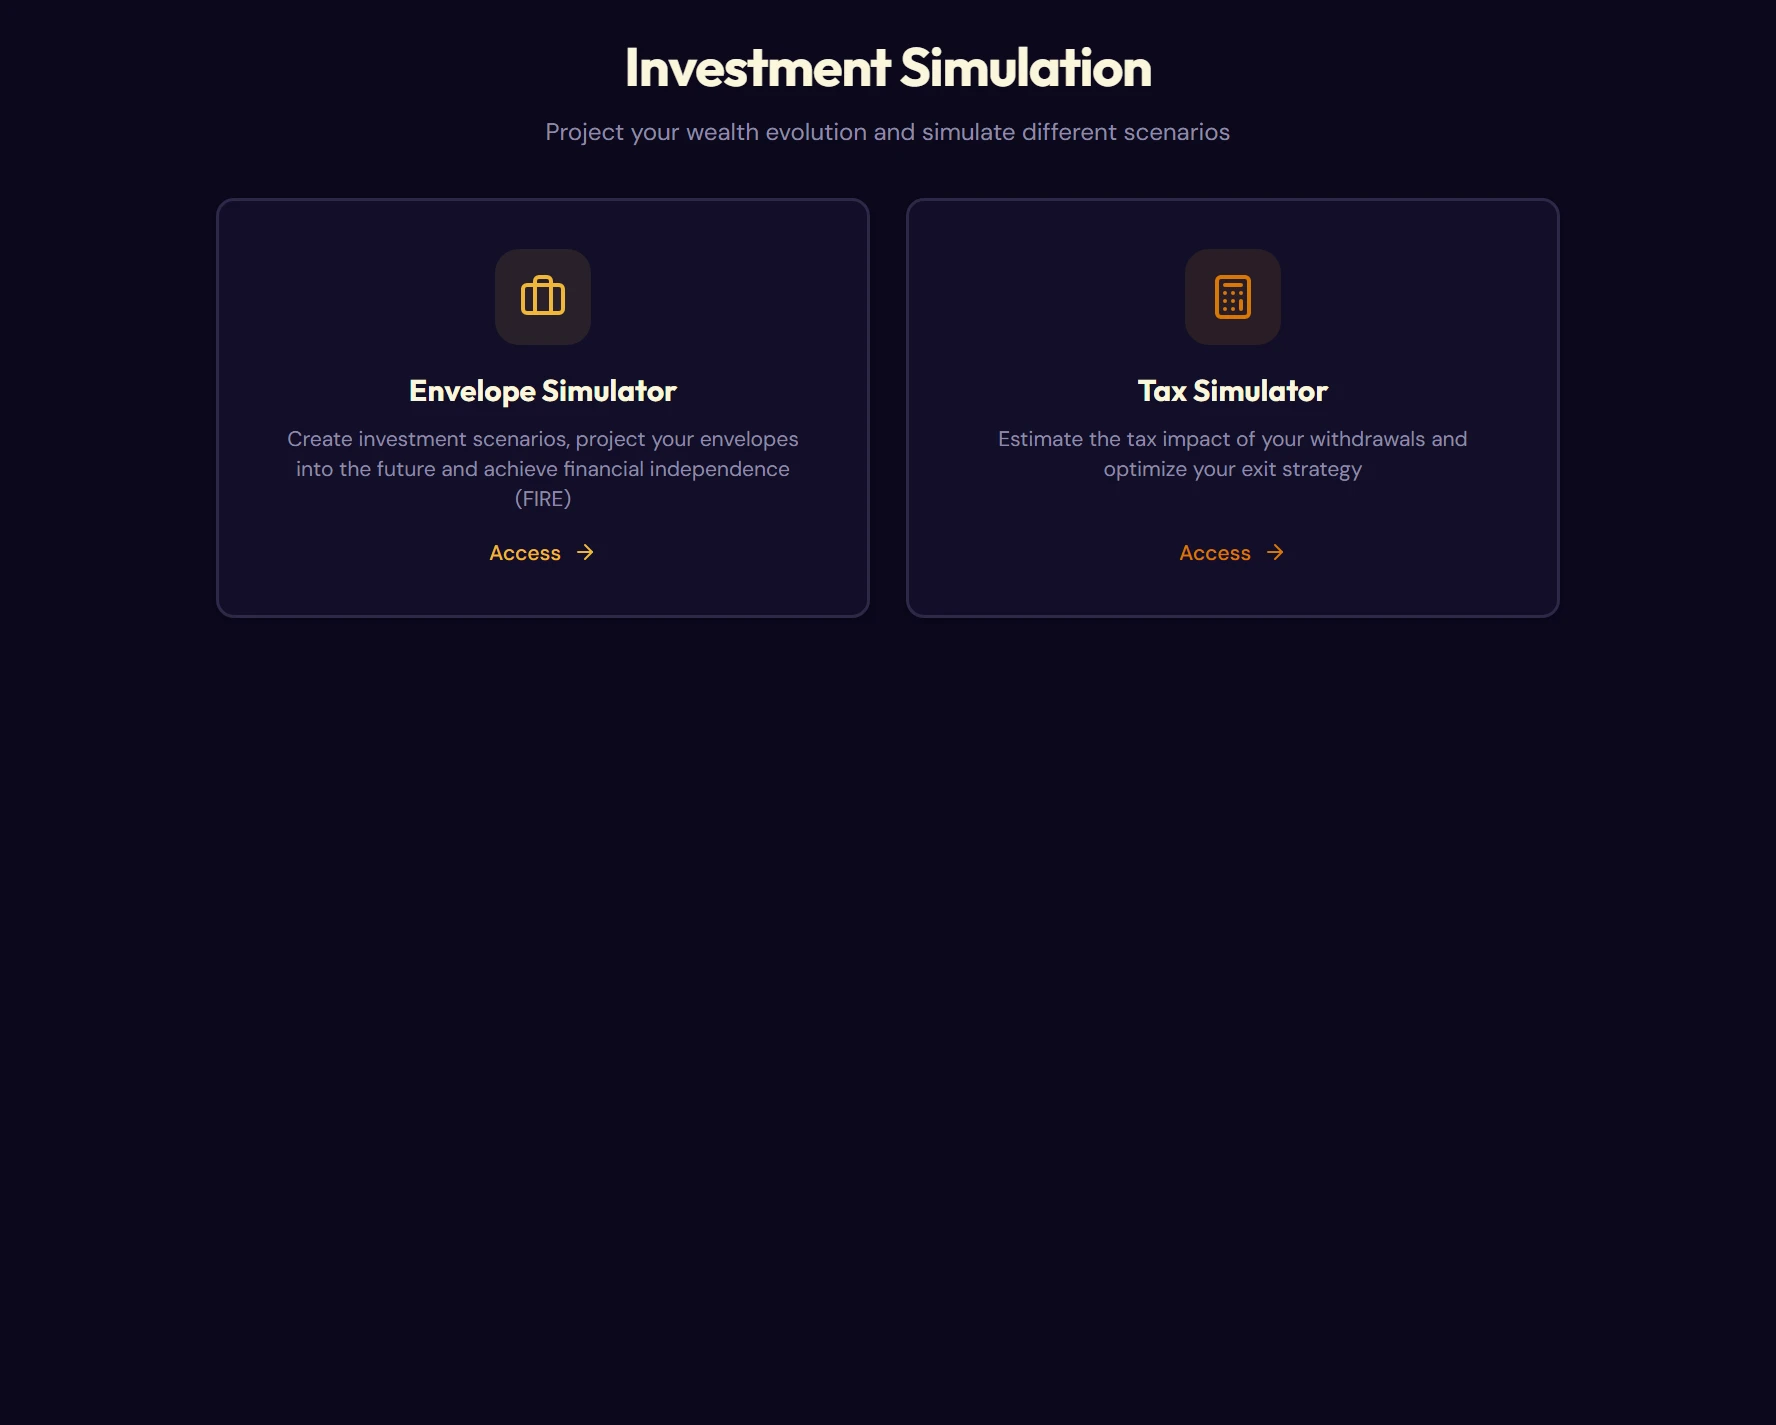
The Simulation page offers two entry points, which answer different questions.
- Envelope Simulator: “Where will my wealth be in 10, 20 or 30 years?” It is the main tool, described throughout this chapter.
- Tax Simulator: “How much will the State take if I withdraw now?” It is covered in chapter 11, with the rest of taxation.
10.2The list of your simulations
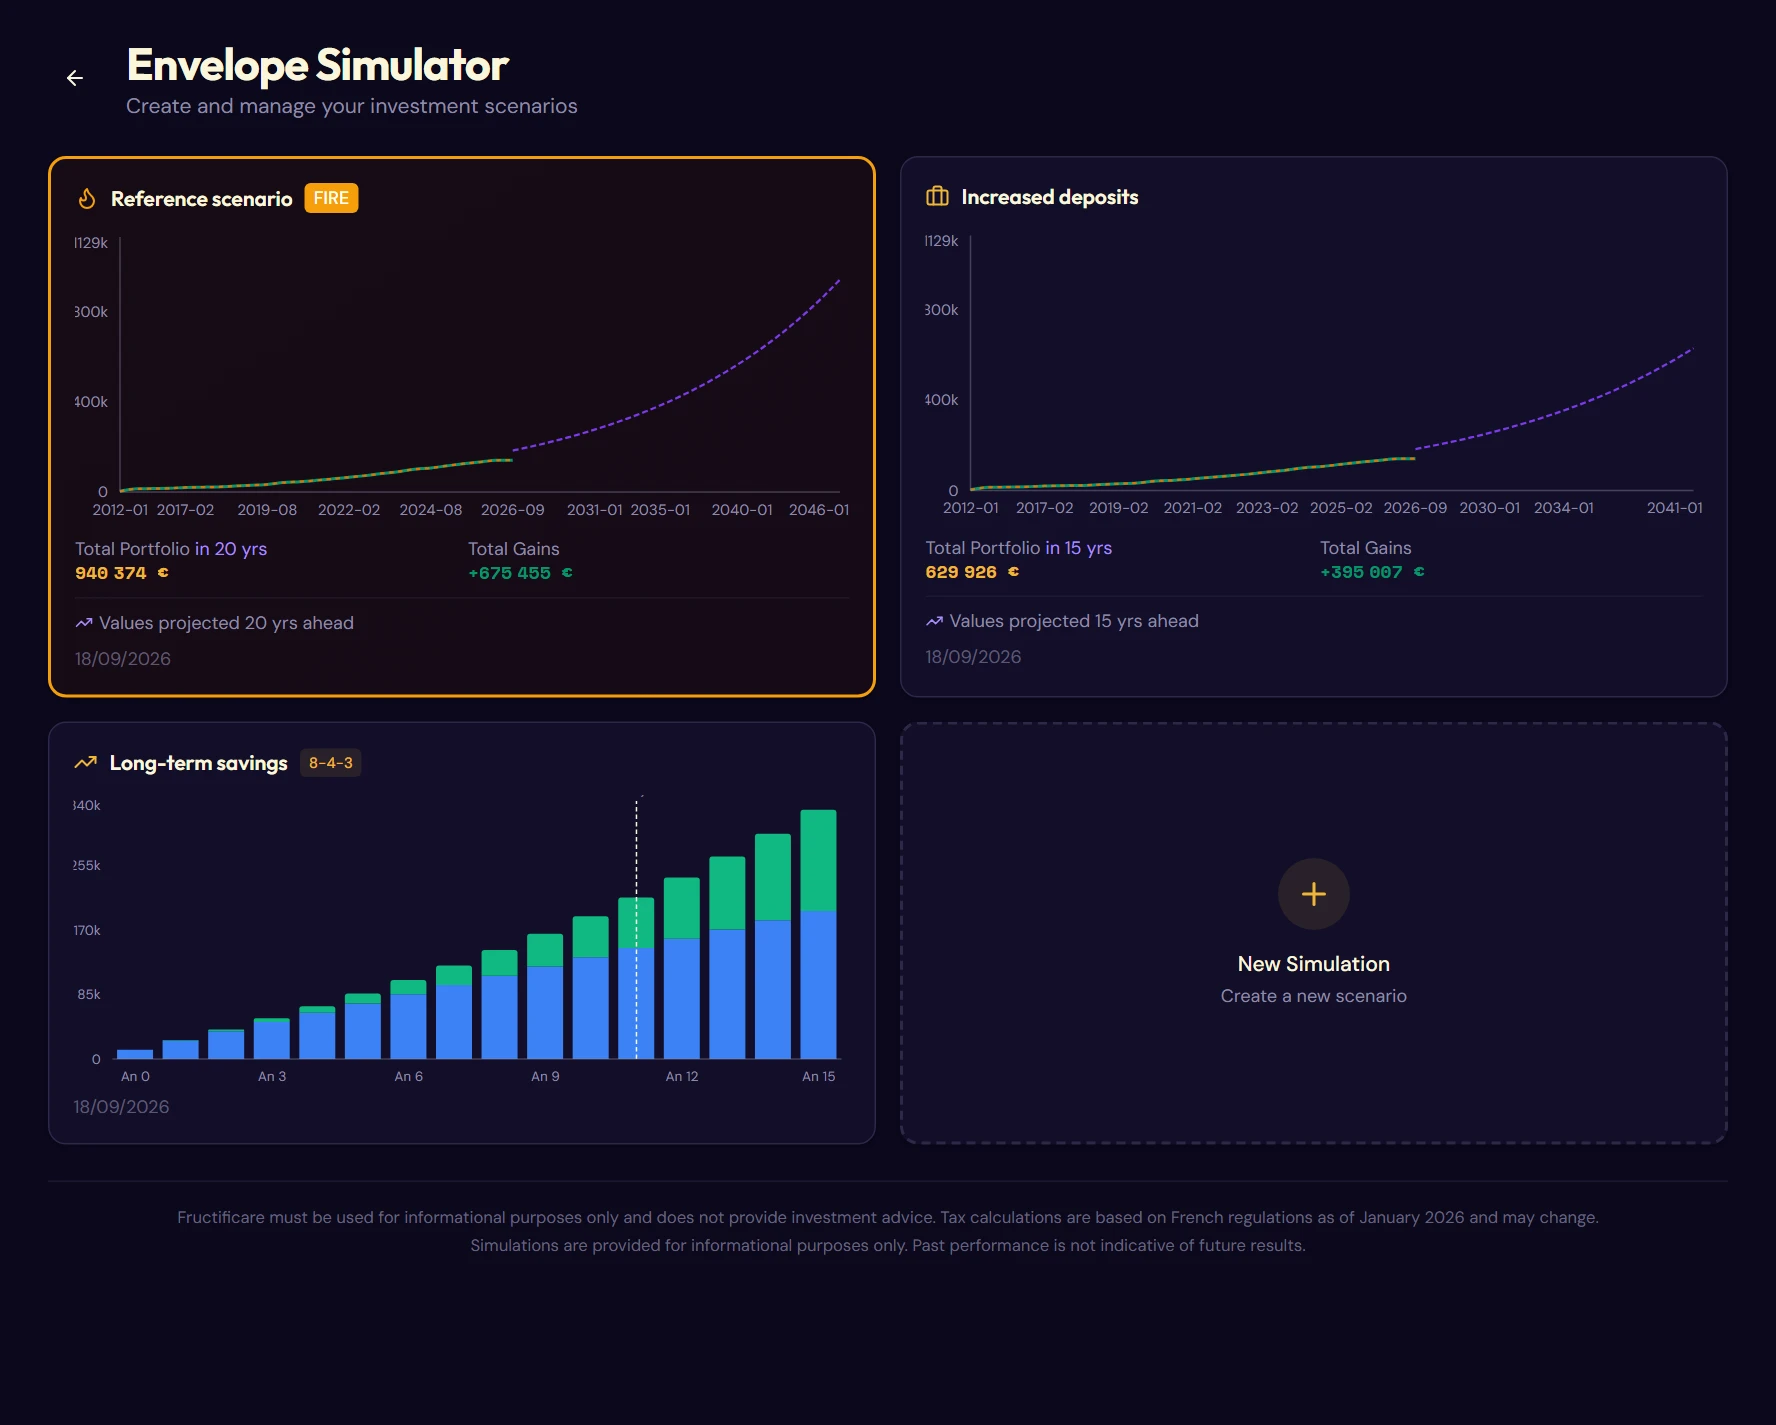
Each scenario you create becomes a tile:
- a mini chart: value, deposits, and the projection in purple;
- Total Portfolio and Total Gains at the horizon you chose last time;
- the saved horizon, shown in purple next to the label (“in 20 yrs”);
- the date the scenario was created.
Creating a simulation
Creating one takes two steps.
- Choose the type. A Classic simulation is for projecting your envelopes freely; an 8-4-3 rule simulation is a teaching exercise (§ 10.5).
- For a classic simulation: give the scenario a name, then choose Import my current envelopes, your real envelopes are copied with their recurring deposits, or Start from a blank simulation, to build a hypothetical portfolio.
10.3The details of a simulation
Opening a simulation gives access to a parallel dashboard, with its own settings.
The toolbar
| Tool | What it does |
|---|---|
| Inflation | When on, inflation is deducted from the return of each movement: projected amounts are then expressed in today's euros. The inflation rate can be changed by clicking the right-hand part of the button. |
| FIRE Settings | Your monthly needs and your safe withdrawal rate. The required capital is recalculated live. These settings are shared with the rest of the application. |
| Stress Test | Applies a crash on a chosen date: stocks, ETFs and bonds −20%, crypto −50%; euro funds, real estate, SCPI, gold and exotic assets are not affected. |
| Recurring movements | Opens the panel of scheduled deposits, applied to the simulation only. |
| Delete Simulation | Erases the scenario. Your real envelopes are not affected. |
The achievement banners
- Crossover Point reached: your cumulative interest exceeds the sum of your deposits. The tipping point after which your capital works harder than you do.
- Financial Independence Achieved (FIRE): your passive income covers your declared monthly needs. The banner shows the surplus and the percentage reached.
The tiles and the fees
Total portfolio, total deposited, net interest (in euros and as a percentage), FIRE progress and FIRE target. A separate card shows the split of fees between entry fees and annual fees, and their cumulative impact at the horizon: a figure often higher than expected.
The projection controls
Two controls set the horizon: a target date picker (month and year) and a year slider that shows the projected value live while you move it.
10.4The envelope page of a simulation
Clicking a simulation envelope opens the same page as in chapter 5, drawn from the scenario's data. No need to describe it again: only three things change.
- Isolated space: nothing you do here shows up on your dashboard.
- Extended charts: the curves continue into the future, at the envelope's target return.
- Simplified calibration: the calibration window does not ask for the breakdown by position.
10.5The 8-4-3 rule
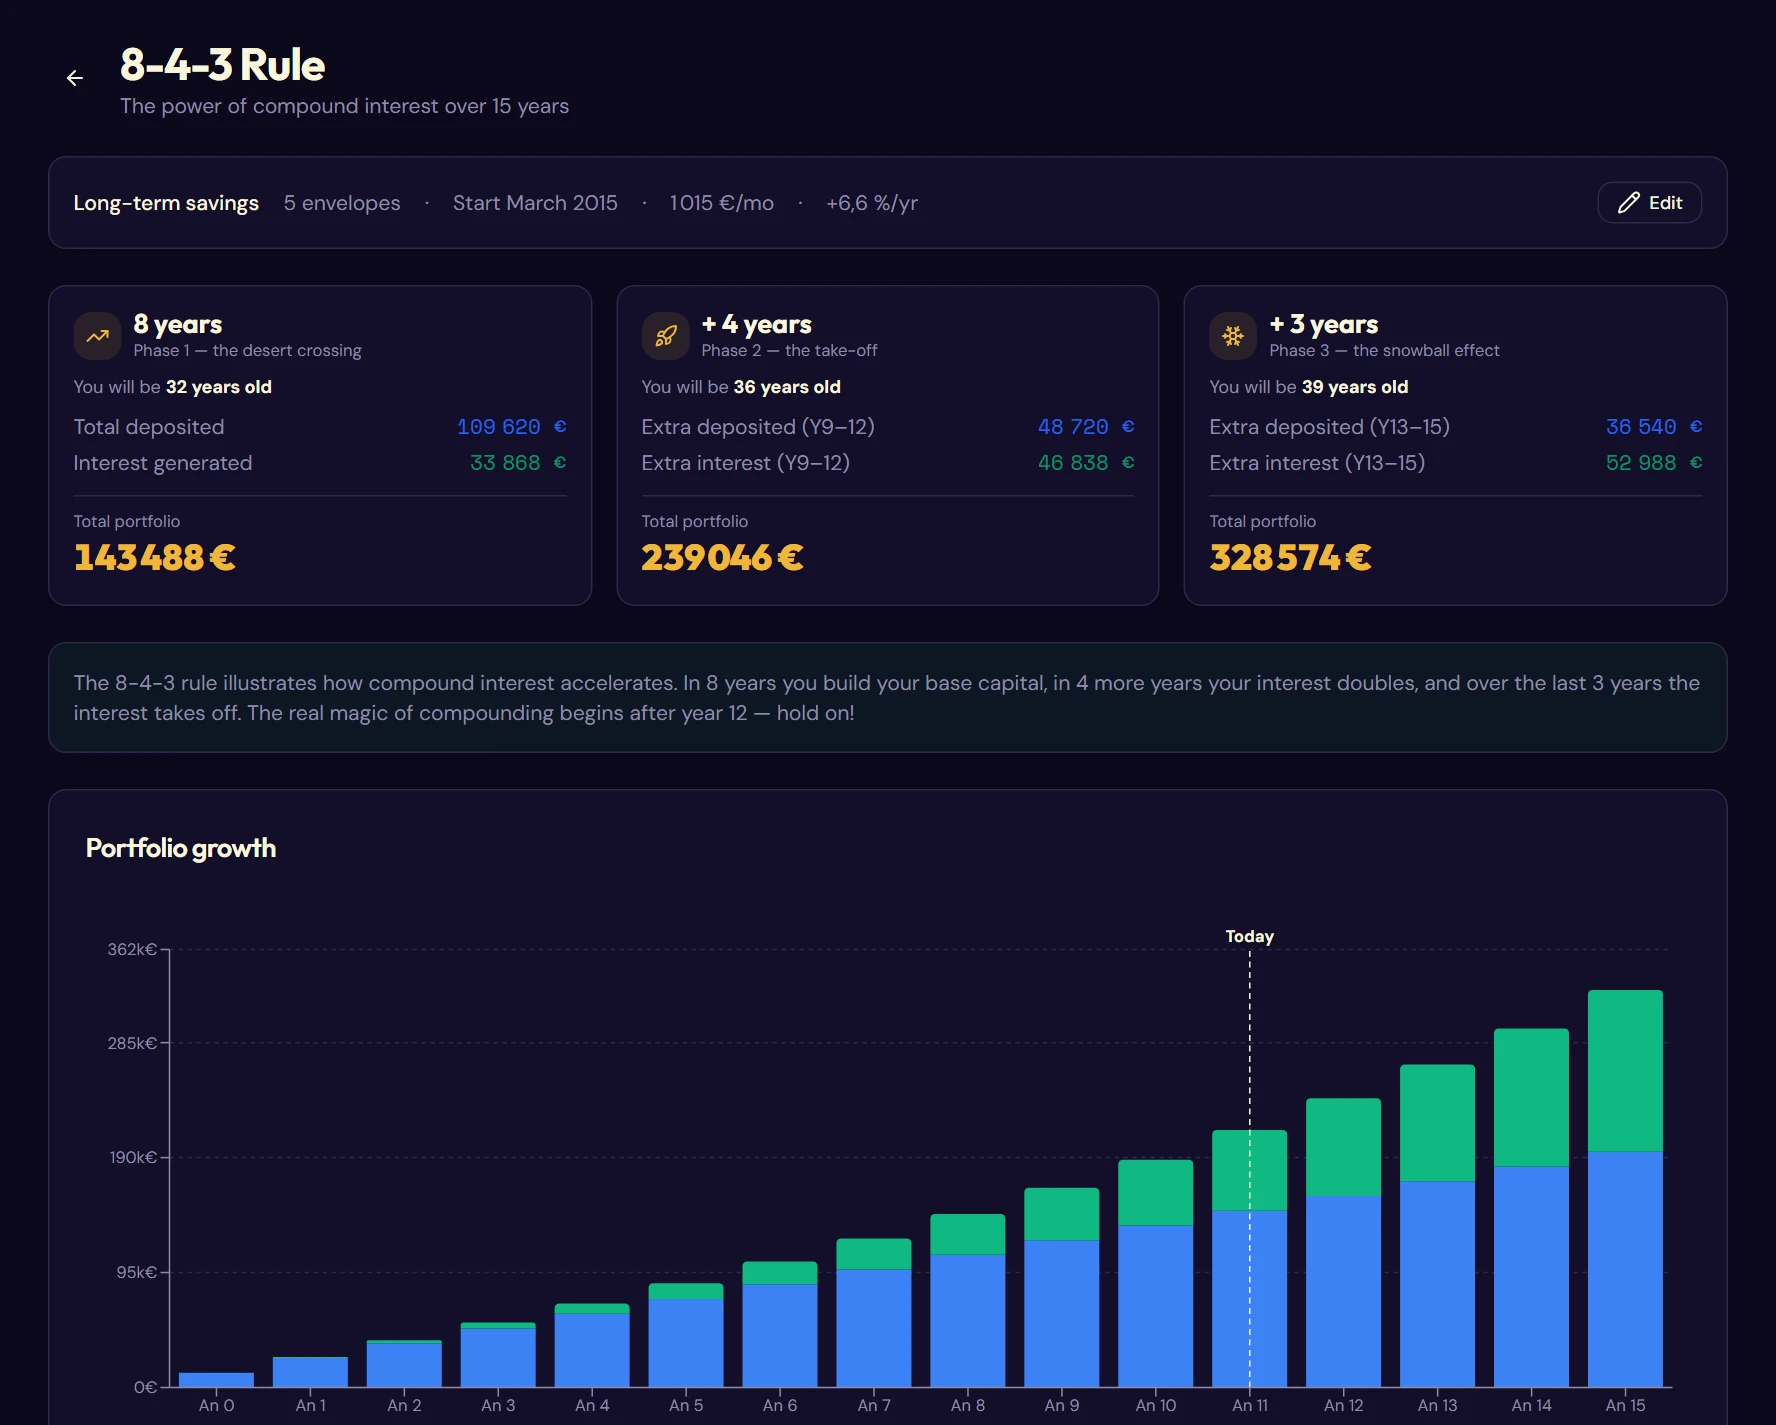
The 8-4-3 rule is a teaching exercise to visualize the power of compound interest. It illustrates a simple idea: interest takes a long time to get going, then accelerates exponentially.
The formula: in 8 years you build your base capital; in 4 more years your interest grows fast; and during the last 3 years, interest takes off.
Configuring
The configuration panel asks for a simulation name, the envelopes to include, a start date (Year 0), a starting capital, a monthly deposit and an annual return.
Reading the result
- Three phase cards: “the desert crossing” (8 years), “the take-off” (+4 years), “the snowball effect” (+3 years).
- Stacked bar chart over 15 years, separating deposits and interest, with a “Today” marker.
- Summary tiles: total paid in, total interest, final capital.
- Progress calendar: 180 squares, one per month, showing the gain of each month elapsed.
- Year-by-year table: past years in regular type, future years in italics.