Chapter 4
The dashboard
Create your envelopes and read the tiles, charts and returns.
7 min read, 9 sections
On this page
This is the home page of Fructificare. It shows you where your current wealth stands.
4.1The progress banners
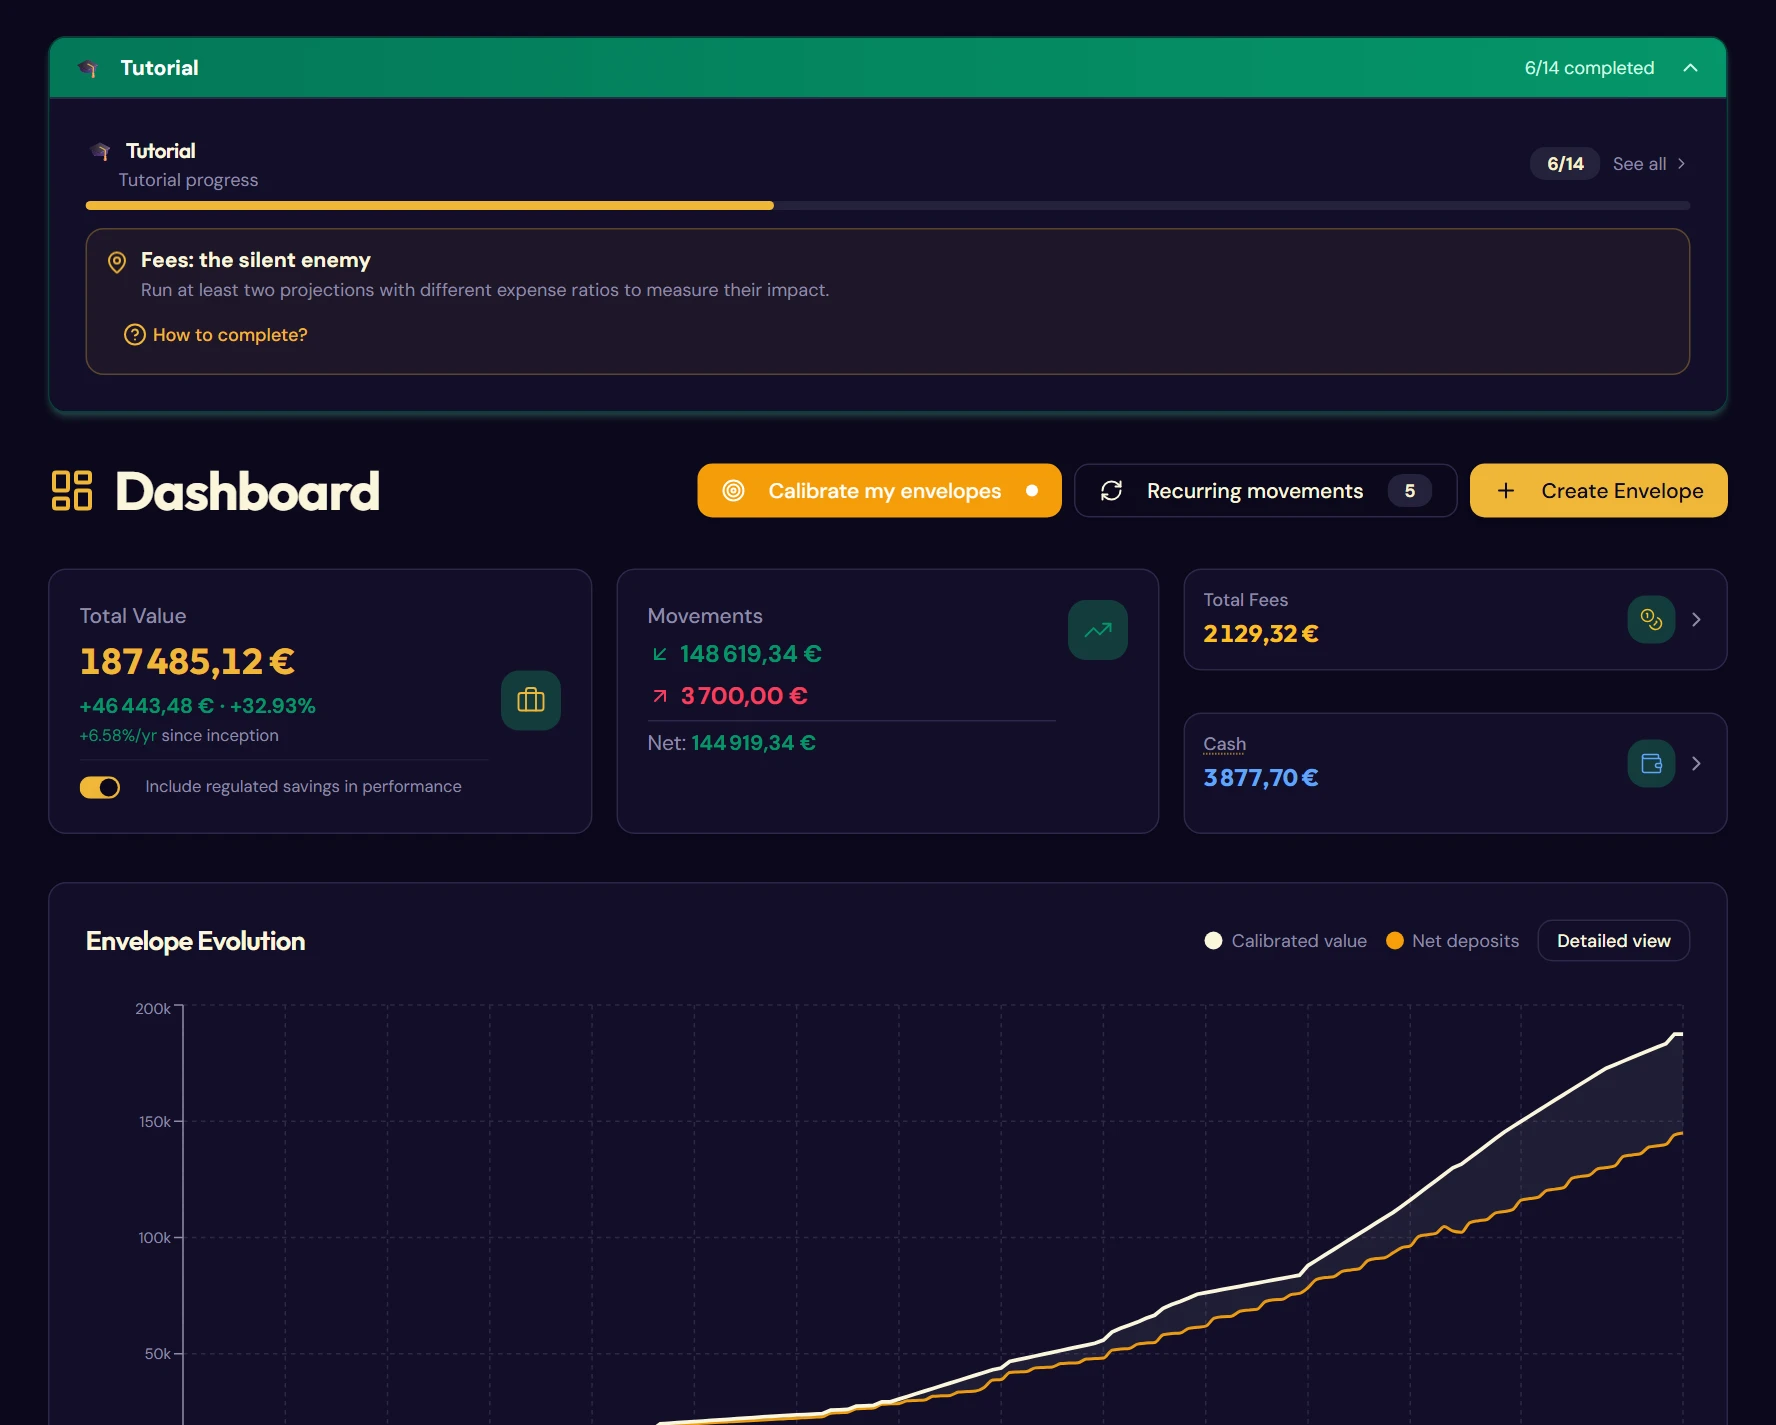
At the top of the page, two collapsible banners accompany your first steps.
- Tutorial: the current mission and your progress through the fourteen quests (§ 1.7). It disappears for good once the path is complete.
- Challenge of the month: the monthly mission and the number of days left to complete it (§ 13.5).
A click on the banner folds or unfolds the section.
4.2The action bar
Three buttons, at the top right of the title.
Calibrate my envelopes
Opens the window for entering real values (chapter 6). The button turns amber and blinks when a calibration is overdue, that is when one of your envelopes has never been calibrated or its last calibration is more than thirty days old.
Recurring movements
Opens the panel of scheduled deposits and withdrawals (chapter 8). The number shown to the right of the label is the number of active series.
Create Envelope
Described in § 4.3 below.
On the left, next to the page title, a flame shows your login streak: the number of consecutive days on which you opened the application (§ 13.5).
4.3Creating an envelope
An envelope represents a real account: your PEA with a given broker, your life insurance contract, your Livret A. Create as many as you hold.
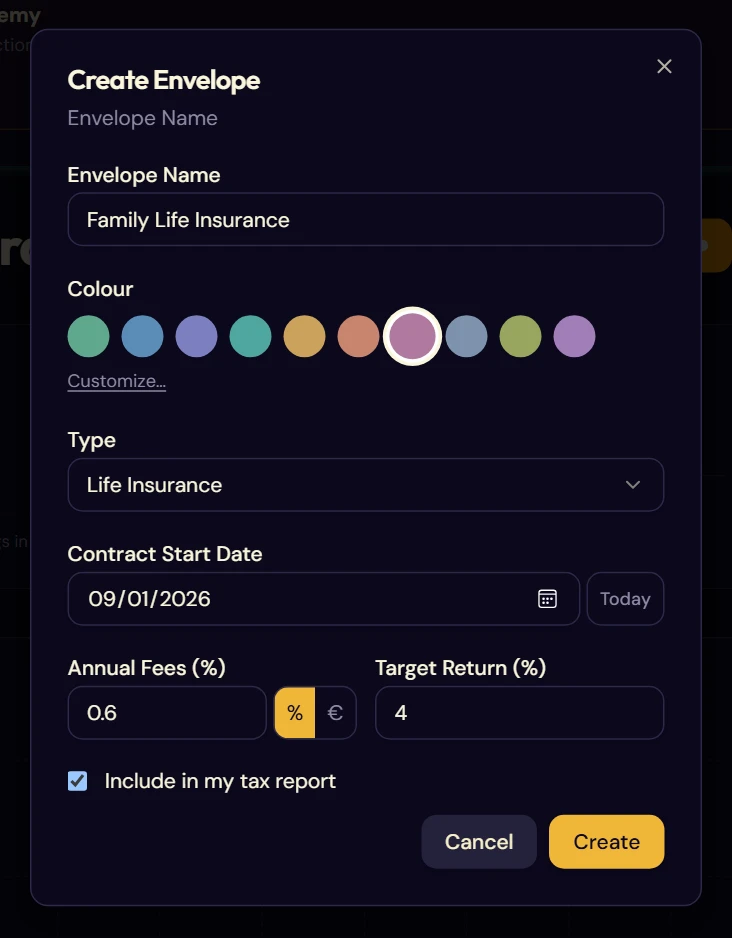
- Click Create Envelope.
- Give it a recognizable name: the name of the institution works very well.
- Choose a color. Fructificare suggests a shade that is not used yet. This color will follow the envelope everywhere: table rows, curves, pie charts, calendar.
- Select the type. It determines the taxation applied and the holding-period milestones.
- Enter the contract start date.
- Adjust the annual fees and the target return if you know them.
- Confirm with Create.
The six envelope types
| Type | What for | Taxation |
|---|---|---|
| PEA | European stocks and ETFs | Income tax exempt after 5 years |
| CTO | Ordinary securities account, crypto | Flat tax 31.4% |
| Life Insurance | Multi-fund contract | Allowance after 8 years |
| PER | Retirement savings | Flat tax 31.4% |
| Regulated Account | Livret A, LDDS, LEP | Exempt |
| Custom | Everything else | No automatic calculation |
If you choose Regulated Account, a second menu appears to specify the savings account (Livret A, LDDS, LEP or other). These envelopes are excluded by default from the tax report and from performance calculations, but you can change this setting.
The contract start date
This field serves three purposes:
- applying the right tax regime according to the holding period (PEA under or over 5 years, life insurance under or over 8 years);
- showing the tax-maturity indicator on the envelope list (§ 4.7);
- automatically creating an anniversary event in your calendar (§ 9.2).
It also limits entry dates: you cannot record a movement dated before the contract opened.
Annual fees and target return
The annual fees can be entered either as a percentage of the outstanding amount or as a fixed amount in euros per year: switch with the % and € buttons. This is your contract's expense ratio (TER), stated in the general terms.
The annual target return is used as a reference for projections and for the dotted curve on the envelope page (§ 5.6). If left empty, it is filled in by default according to the type:
- PEA and CTO: 8%;
- life insurance and PER: 4%;
- regulated account: 2.4%;
- custom: 0%.
Include in my tax report
Ticked by default, except for regulated accounts. Untick it for an envelope you follow for information only and that has no place in your tax return.
4.4The summary tiles
Four figures sum up your situation. They sit at the top of the page, just below the action bar.

Total Value
The current value of your portfolio, based on your latest calibrations. Below the amount:
- the total gain or loss, in euros and as a percentage;
- the annualized return since inception, calculated using the modified Dietz method (§ 16.3);
- the total of regulated savings accounts, on a separate line.
Movements
The total you have paid in, the total you have withdrawn, and the net balance of the two. Regulated savings accounts are also excluded from it, and shown on a dedicated line.
Total Fees
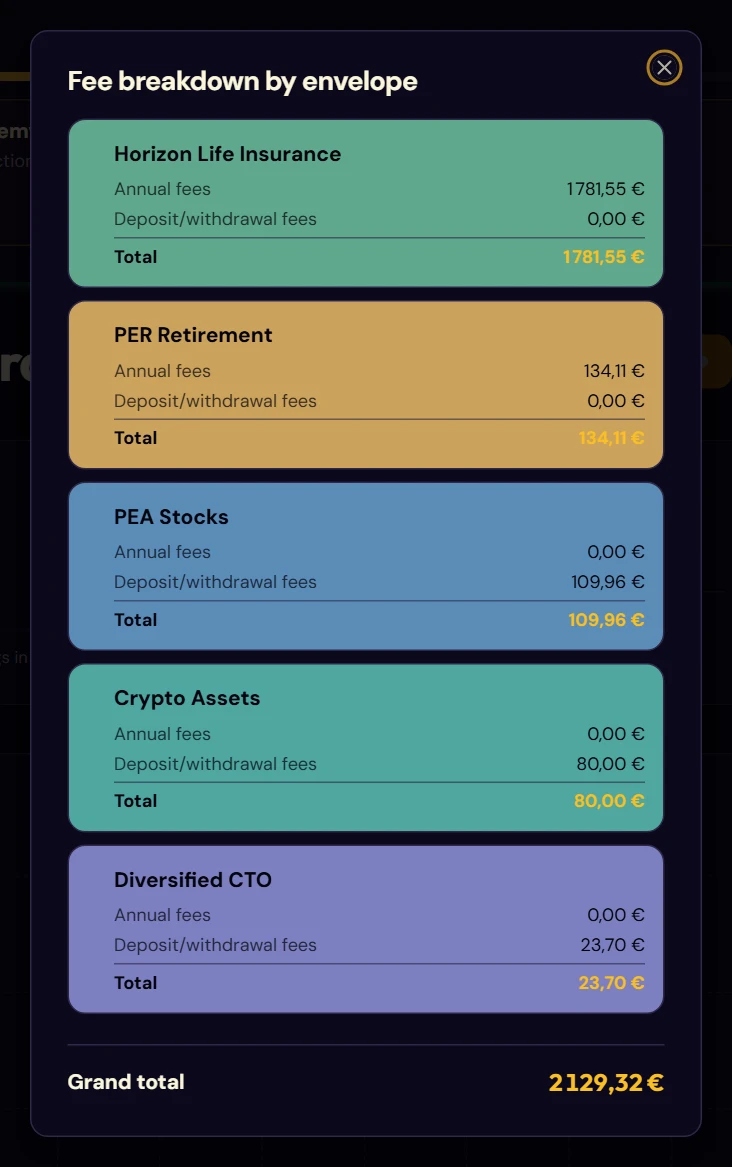
The sum of all your fees since inception: deposit fees, withdrawal fees and accumulated annual management fees. Click the tile to open the breakdown by envelope.
Cash
The total of the cash sitting idle in your envelopes: money available in the account, coming from a sale whose proceeds you chose to keep there, but not yet reinvested (§ 5.5).
Like the fees tile, it is clickable: a small arrow shows it. It opens the cash breakdown by envelope: each envelope holding cash, with its amount, from the largest to the smallest, and the grand total.
4.5Envelope evolution
The first chart traces the value of your portfolio over time. It only appears once there are two calibration points.
Two views are available, through the toggle button at the top right.
- Summary view: the total calibrated value, the net deposits, and between the two a coloured band showing the gain (green) or the loss (red).
- Detailed view: one curve per envelope, in its own color.
The points marked on the curves correspond to the months in which you actually calibrated. Between two points, the value is interpolated.
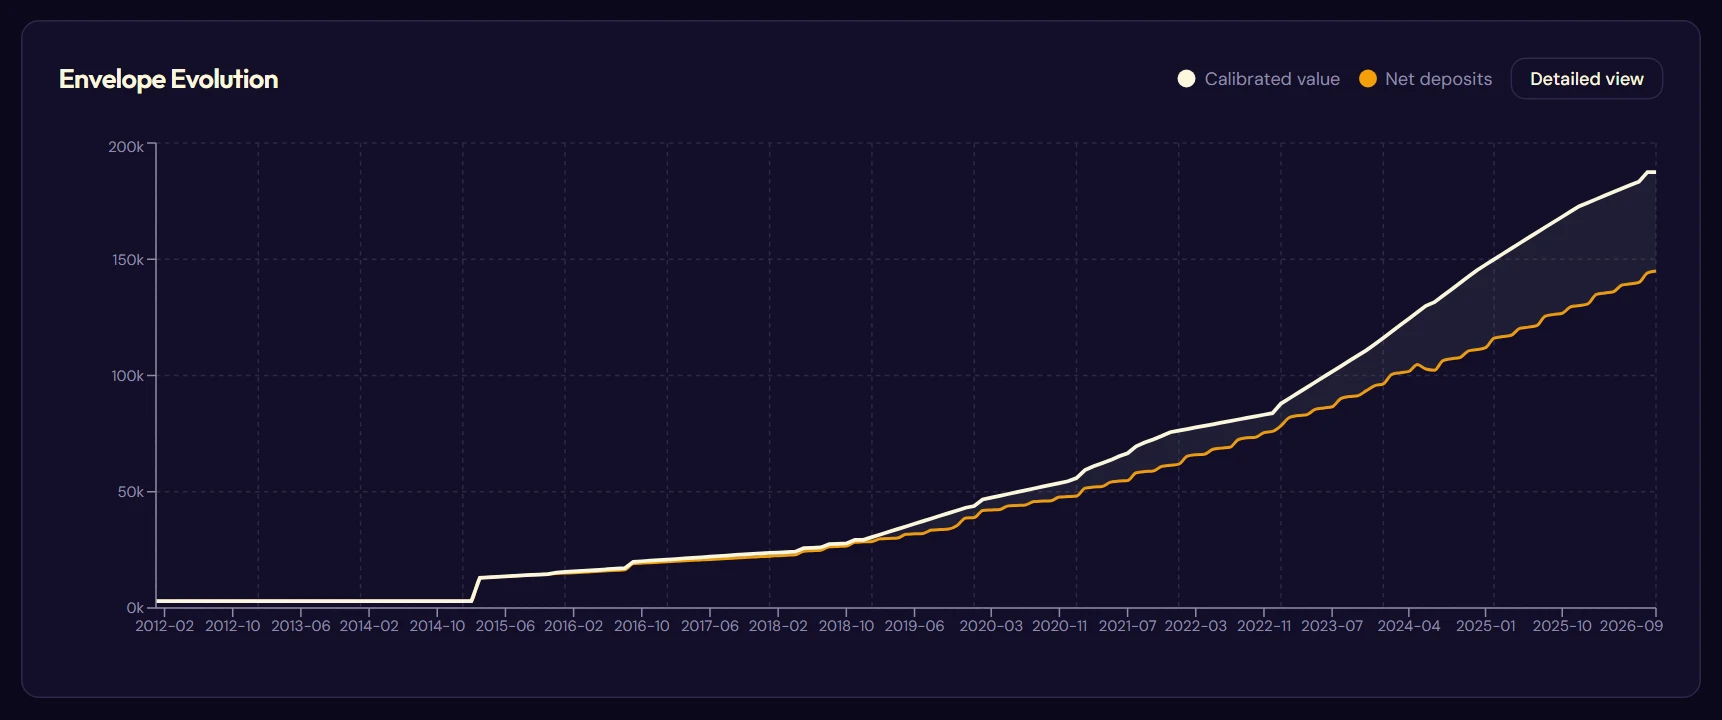
Summary view
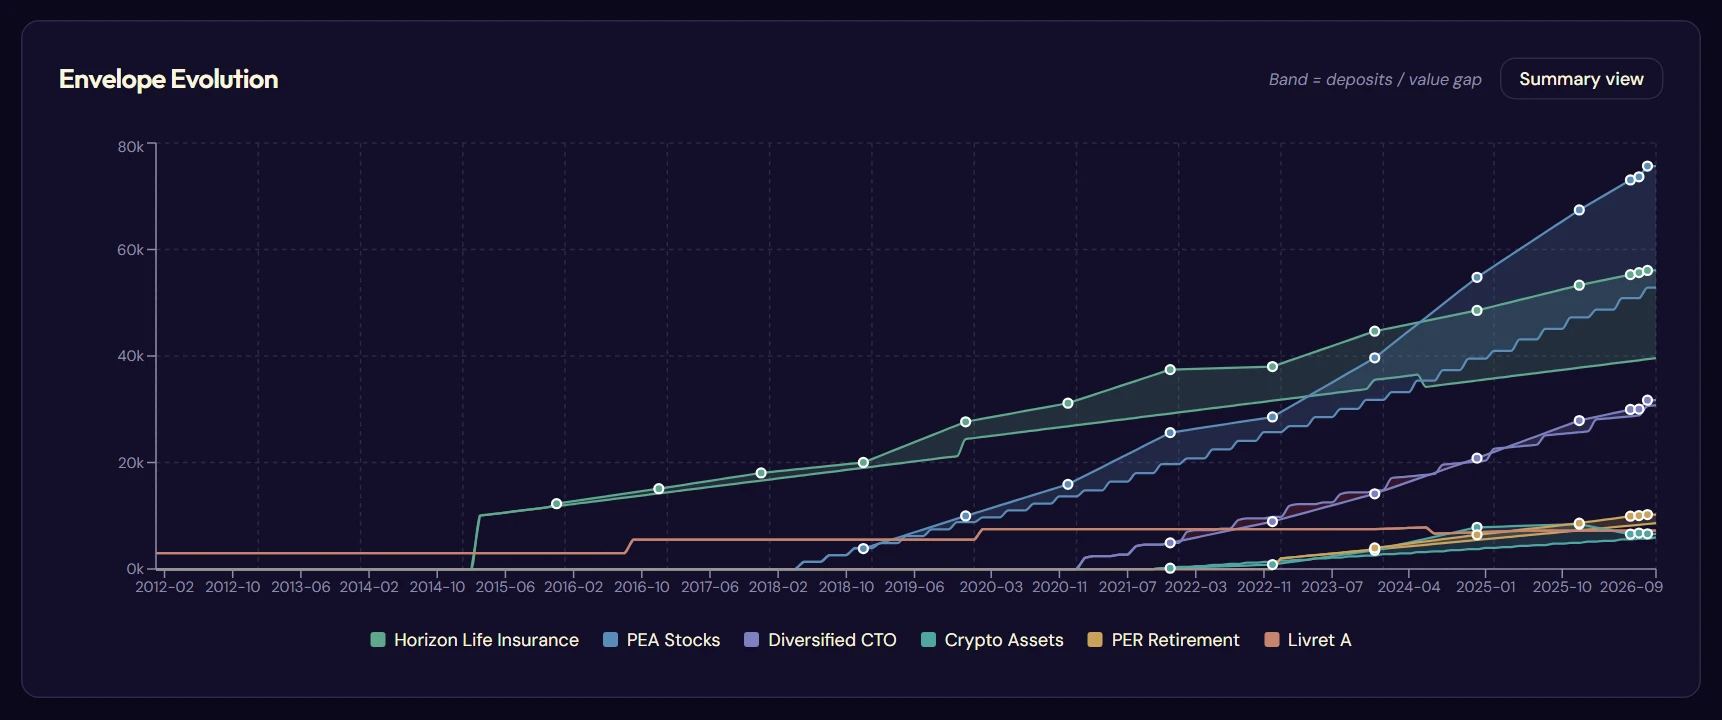
Detailed view
4.6The allocation
The pie chart answers the diversification question: where is my money concentrated?
By envelope or by asset type
The default view shows the share of each account, the second one the share of each asset class: euro funds, bonds, stocks, ETFs, crypto, real estate, SCPI, gold, exotic. The second one is what matters when judging a concentration risk.
Deposits or real value
By default, the pie chart splits your deposits. Switch to real value to reason on calibrated amounts: it is more accurate, since your holdings have not all grown at the same pace.
This toggle stays inactive as long as no calibration exists.
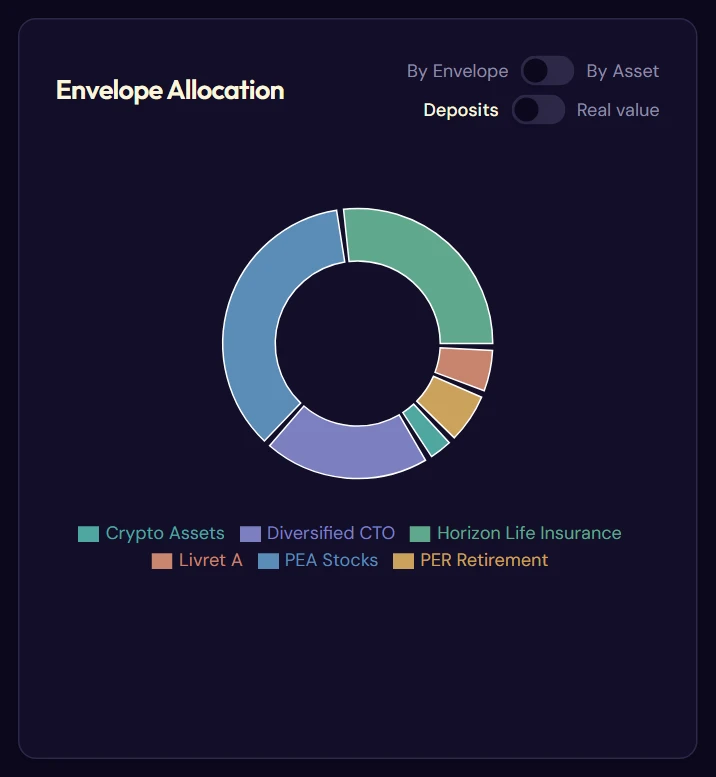
By envelope, deposits
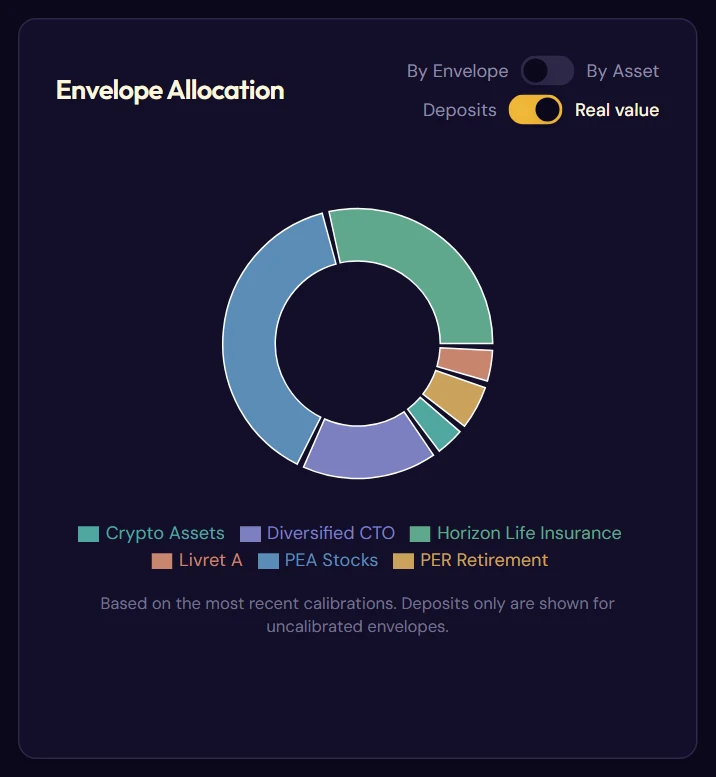
By envelope, real value
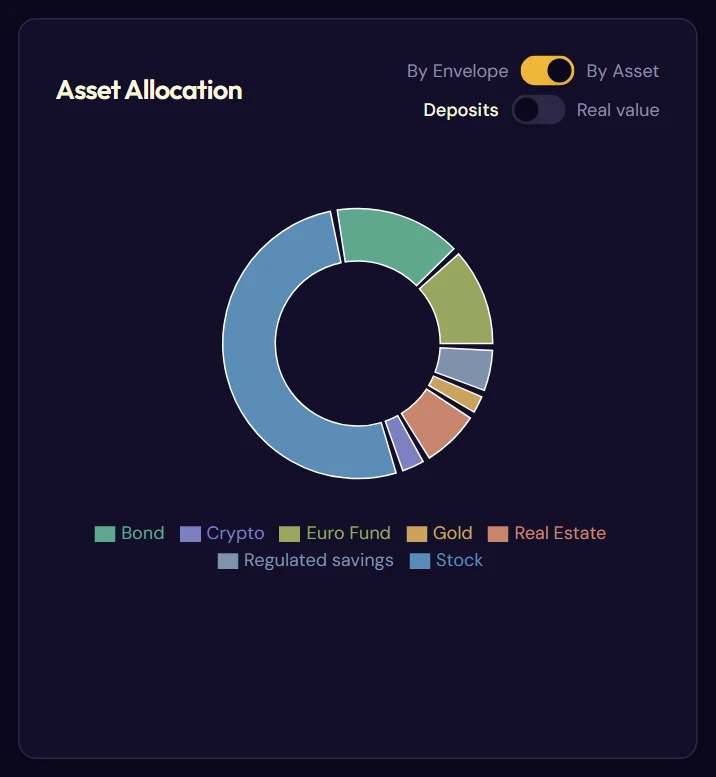
By asset, deposits
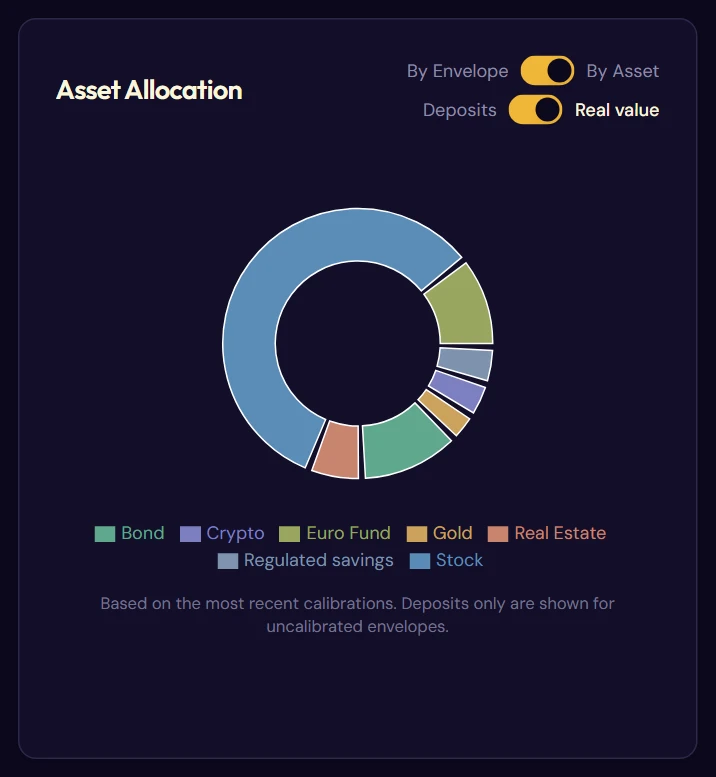
By asset, real value
4.7The envelope list
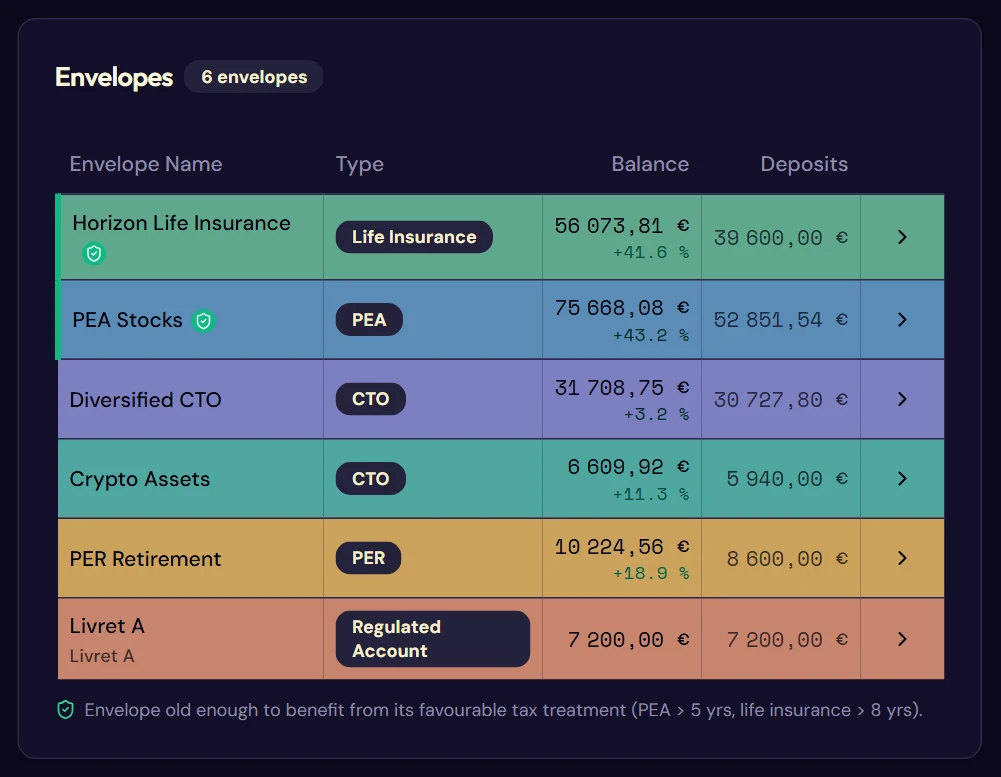
The summary table, to the right of the pie chart. Each row takes the color of its envelope; a click on the row opens the detailed page (chapter 5).
| Column | What it contains |
|---|---|
| Envelope Name | The name of the envelope, and for a savings account its sub-type |
| Type | PEA, CTO, life insurance… |
| Balance | The latest calibrated value, with the gain as a percentage |
| Deposits | The total paid in since inception |
As long as an envelope has not been calibrated, the Balance column simply shows the sum of your deposits and the gain stays empty: Fructificare does not know its real value yet.
The tax-maturity indicator
A green edge on the left of the row and a shield badge next to the name mark an envelope old enough to benefit from its favorable taxation: more than five years for a PEA, more than eight years for a life insurance contract.
Hover over the badge to read the exact advantage. A legend recalls the rule below the table as soon as at least one envelope qualifies.
4.8Cumulative savings
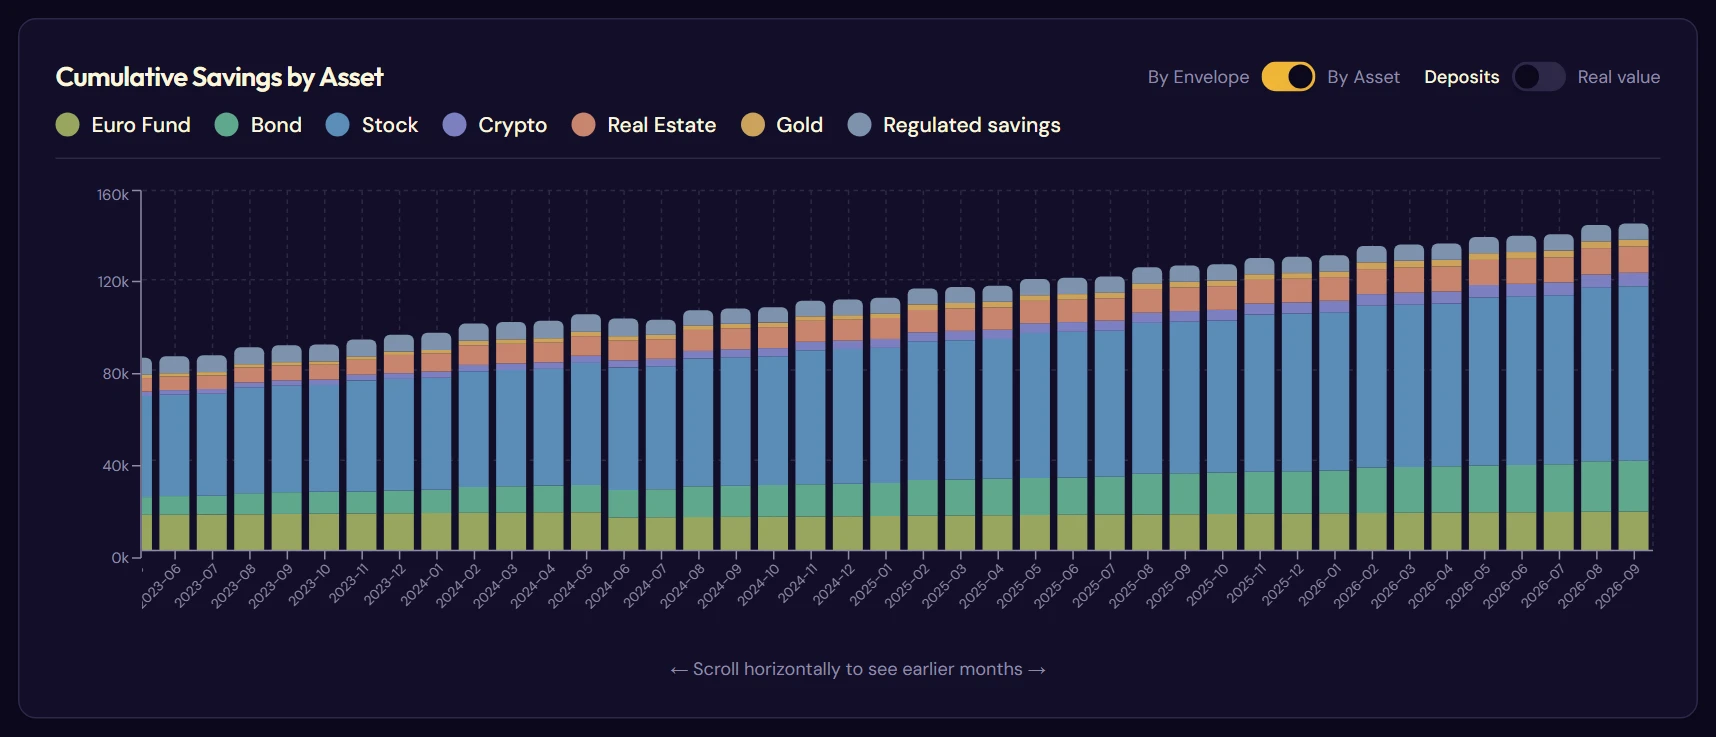
A stacked bar chart, month by month: how much you had invested, and in what, at each stage. It reads as the build-up of your savings effort.
The same envelopes / assets toggle as the pie chart applies. Over a long history, the area scrolls horizontally.
4.9The annual return
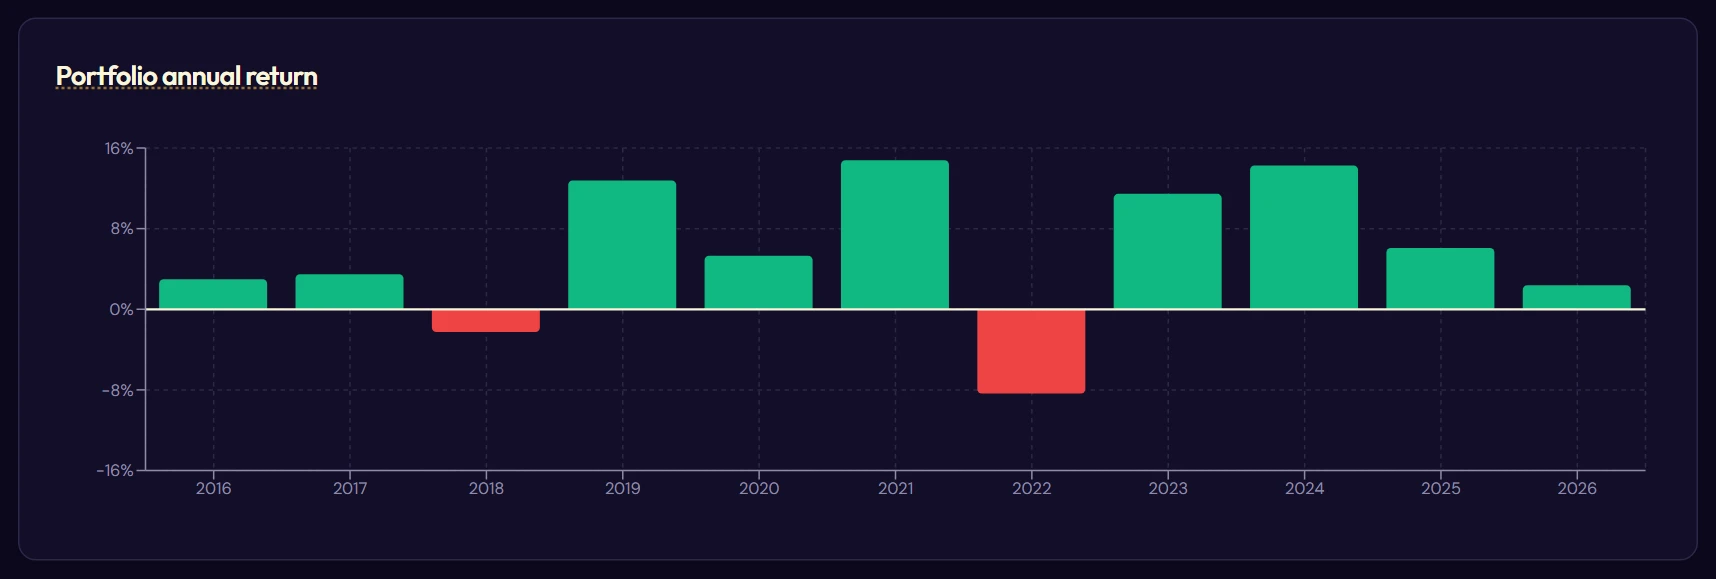
The last chart gives your performance calendar year by calendar year, excluding regulated savings accounts. The current year is marked as year-to-date: it cannot be compared with complete years.
Hover over the title to read the methodology note on the modified Dietz calculation.